SLO Report
The SLO Report report provides a detailed analysis of a specific SLO over a selected time period. It helps track key performance indicators such as Error Budget Consumed, Error Time Left, Burn Rate, and SLIs to assess service reliability. The report includes graphical representations for better visualization and trend analysis. Users can customize the report by renaming SLIs and adding graphs to the dashboard.
Generate the SLO Report
Follow the steps below to generate a SLO Report:
- Log in to your Site24x7 account.
- Navigate to Reports > SLO Report > SLO Report.
- Choose the desired SLO - Monitor, and Time Period to generate the report.
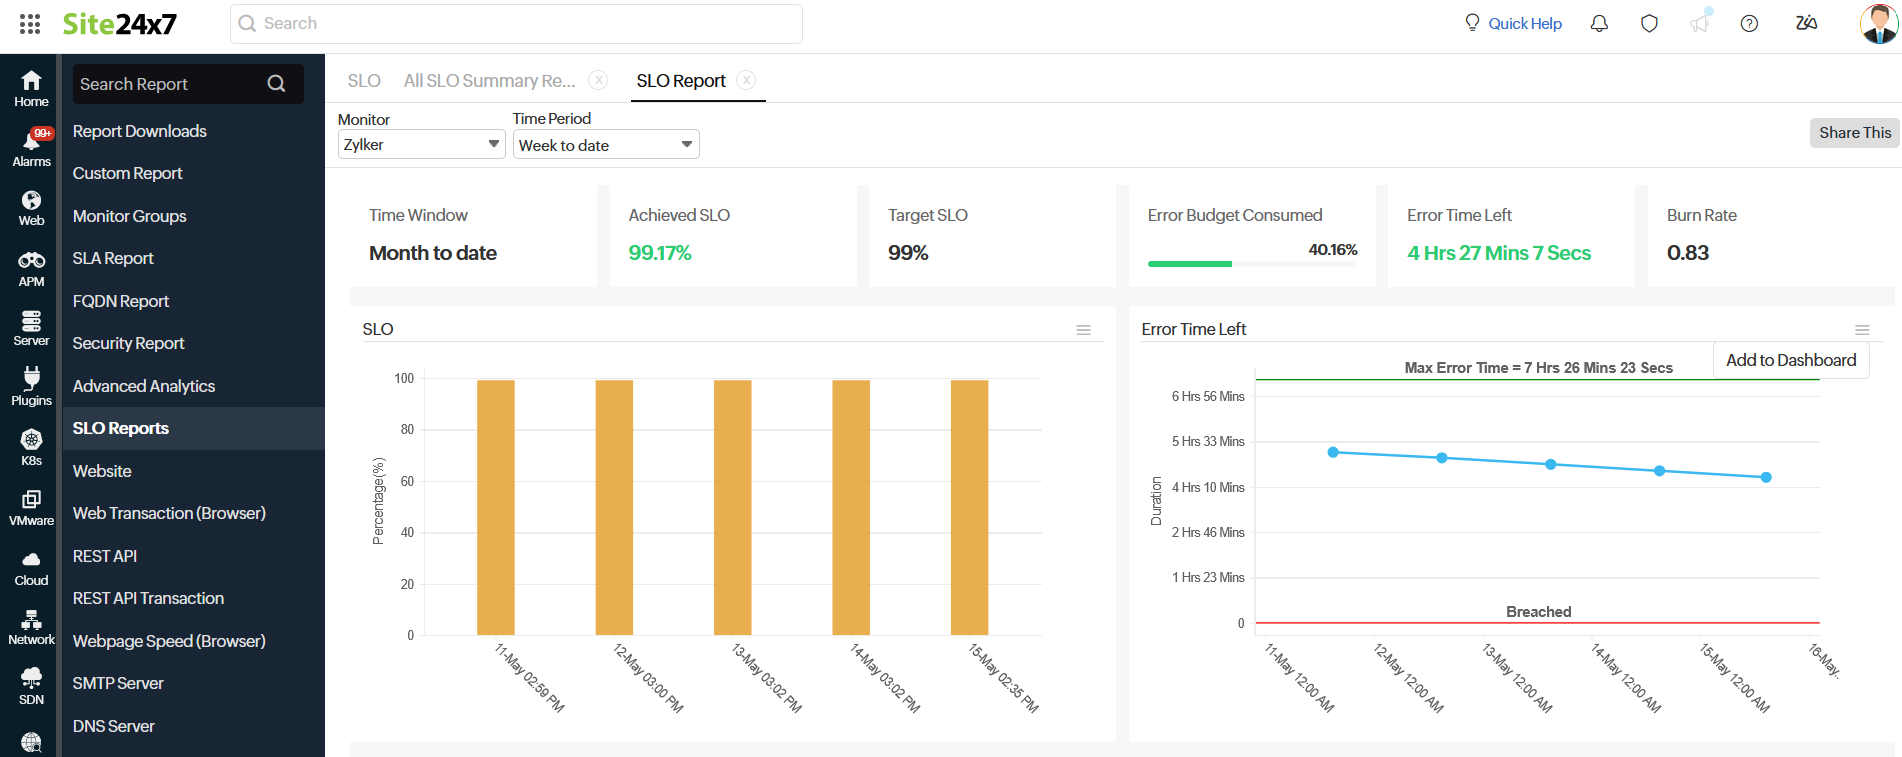
The report for the selected SLO within the specified timeframe will be displayed. This report provides a summary of the SLO.
Interpret the SLO Report
Understand and analyze the SLO Report for insights into a specific SLO based on the selected time period.
The following details can be inferred from the report:
- Rolling Time Window: The continuous period over which the SLO performance is measured.
- Current SLO: The real-time percentage of successful service availability or reliability of the SLO.
- Target SLO: The predefined reliability goal that the service must meet.
- Error Budget Consumed: The percentage of allowable downtime that has been used.
- Error Time Left: The remaining allowable downtime before breaching the SLO.
- Burn Rate: The speed at which the error budget is being consumed.
- The Time Period includes the option Week to Date, which generates the report for the entire week up to the current day, time and completed hour.
- The Time Period includes the option Month to Date, which generates the report for the entire month up to the current day and time.
Graphical interpretation
The SLO Report displays graphical representations of the SLO, Error Time Left, Error Budget Consumed, Burn Rate, and SLIs.
|
SLO 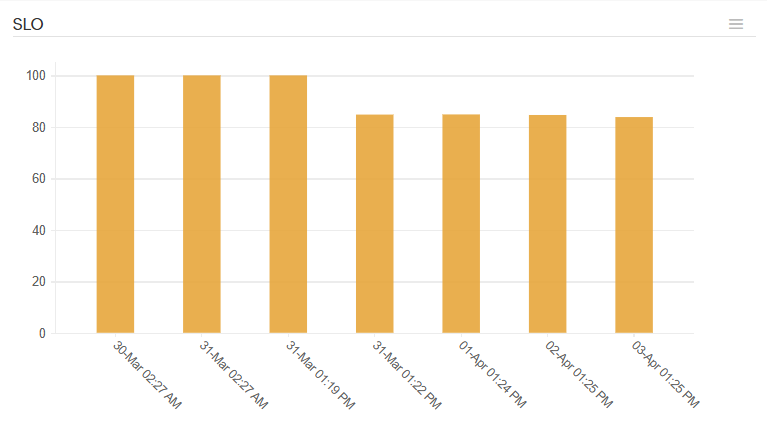 |
Error Time Left 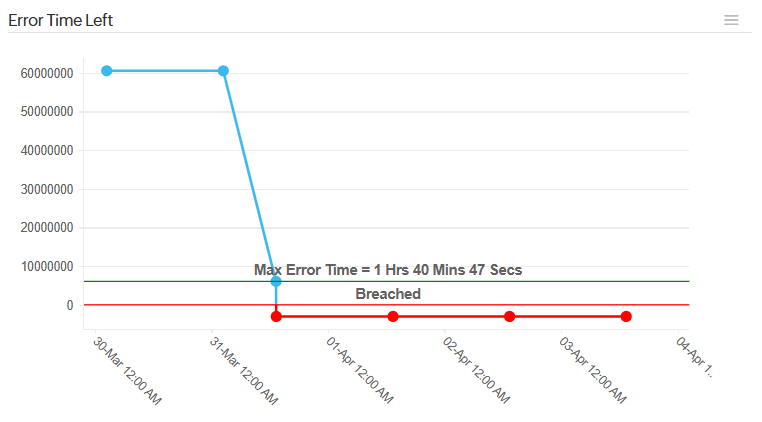 |
|
Error Budget Consumed 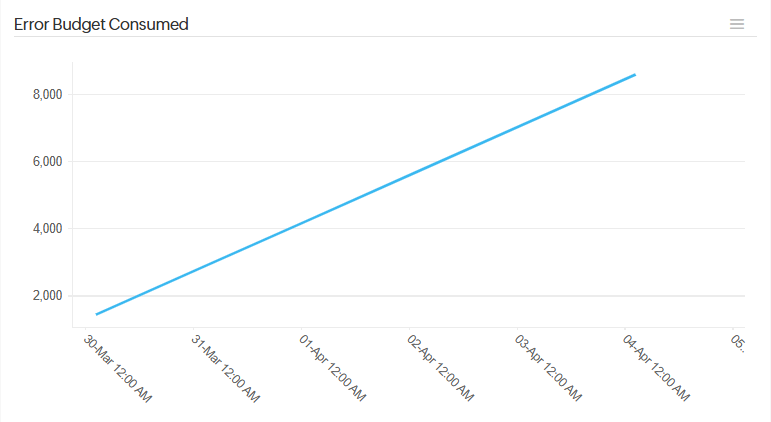 |
Burn Rate 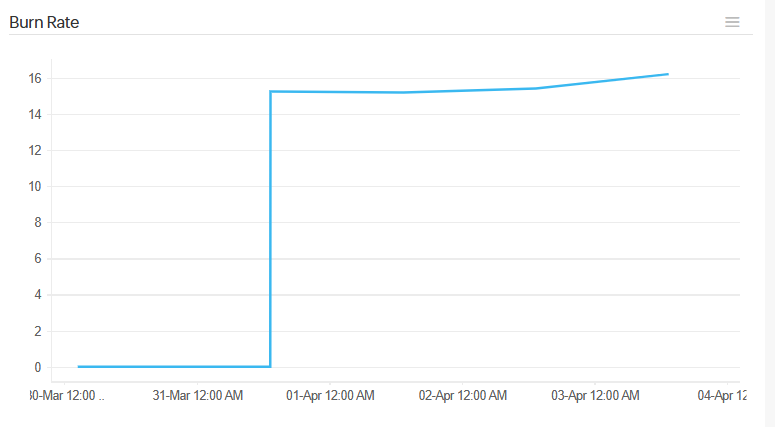 |
|
SLIs 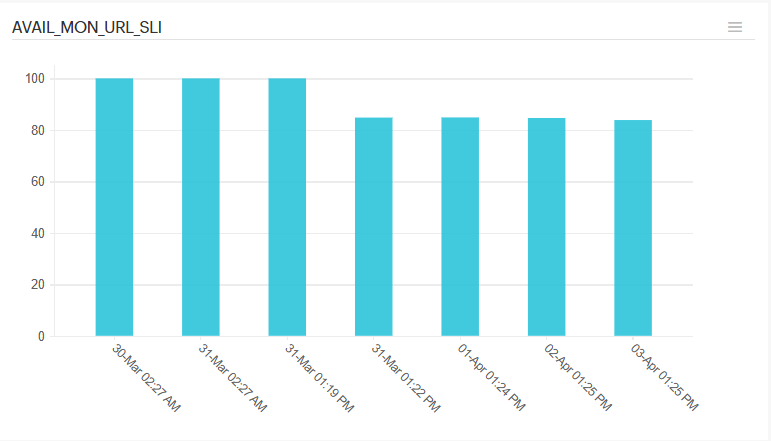 |
- Click the hamburger icon to add the graph to the dashboard. For SLIs, you have the option to change their names.
- The Share This button allows you to share the report via email or download it as a CSV or PDF file.
