Performance Metrics of vCenter Monitors
The configured vCenter monitors can be accessed by navigating to VMware > vCenter page after logging in to Site24x7.
Click on a vCenter monitor to view the summary, ESX/ESXi hosts, resource pools, and virtual machines.
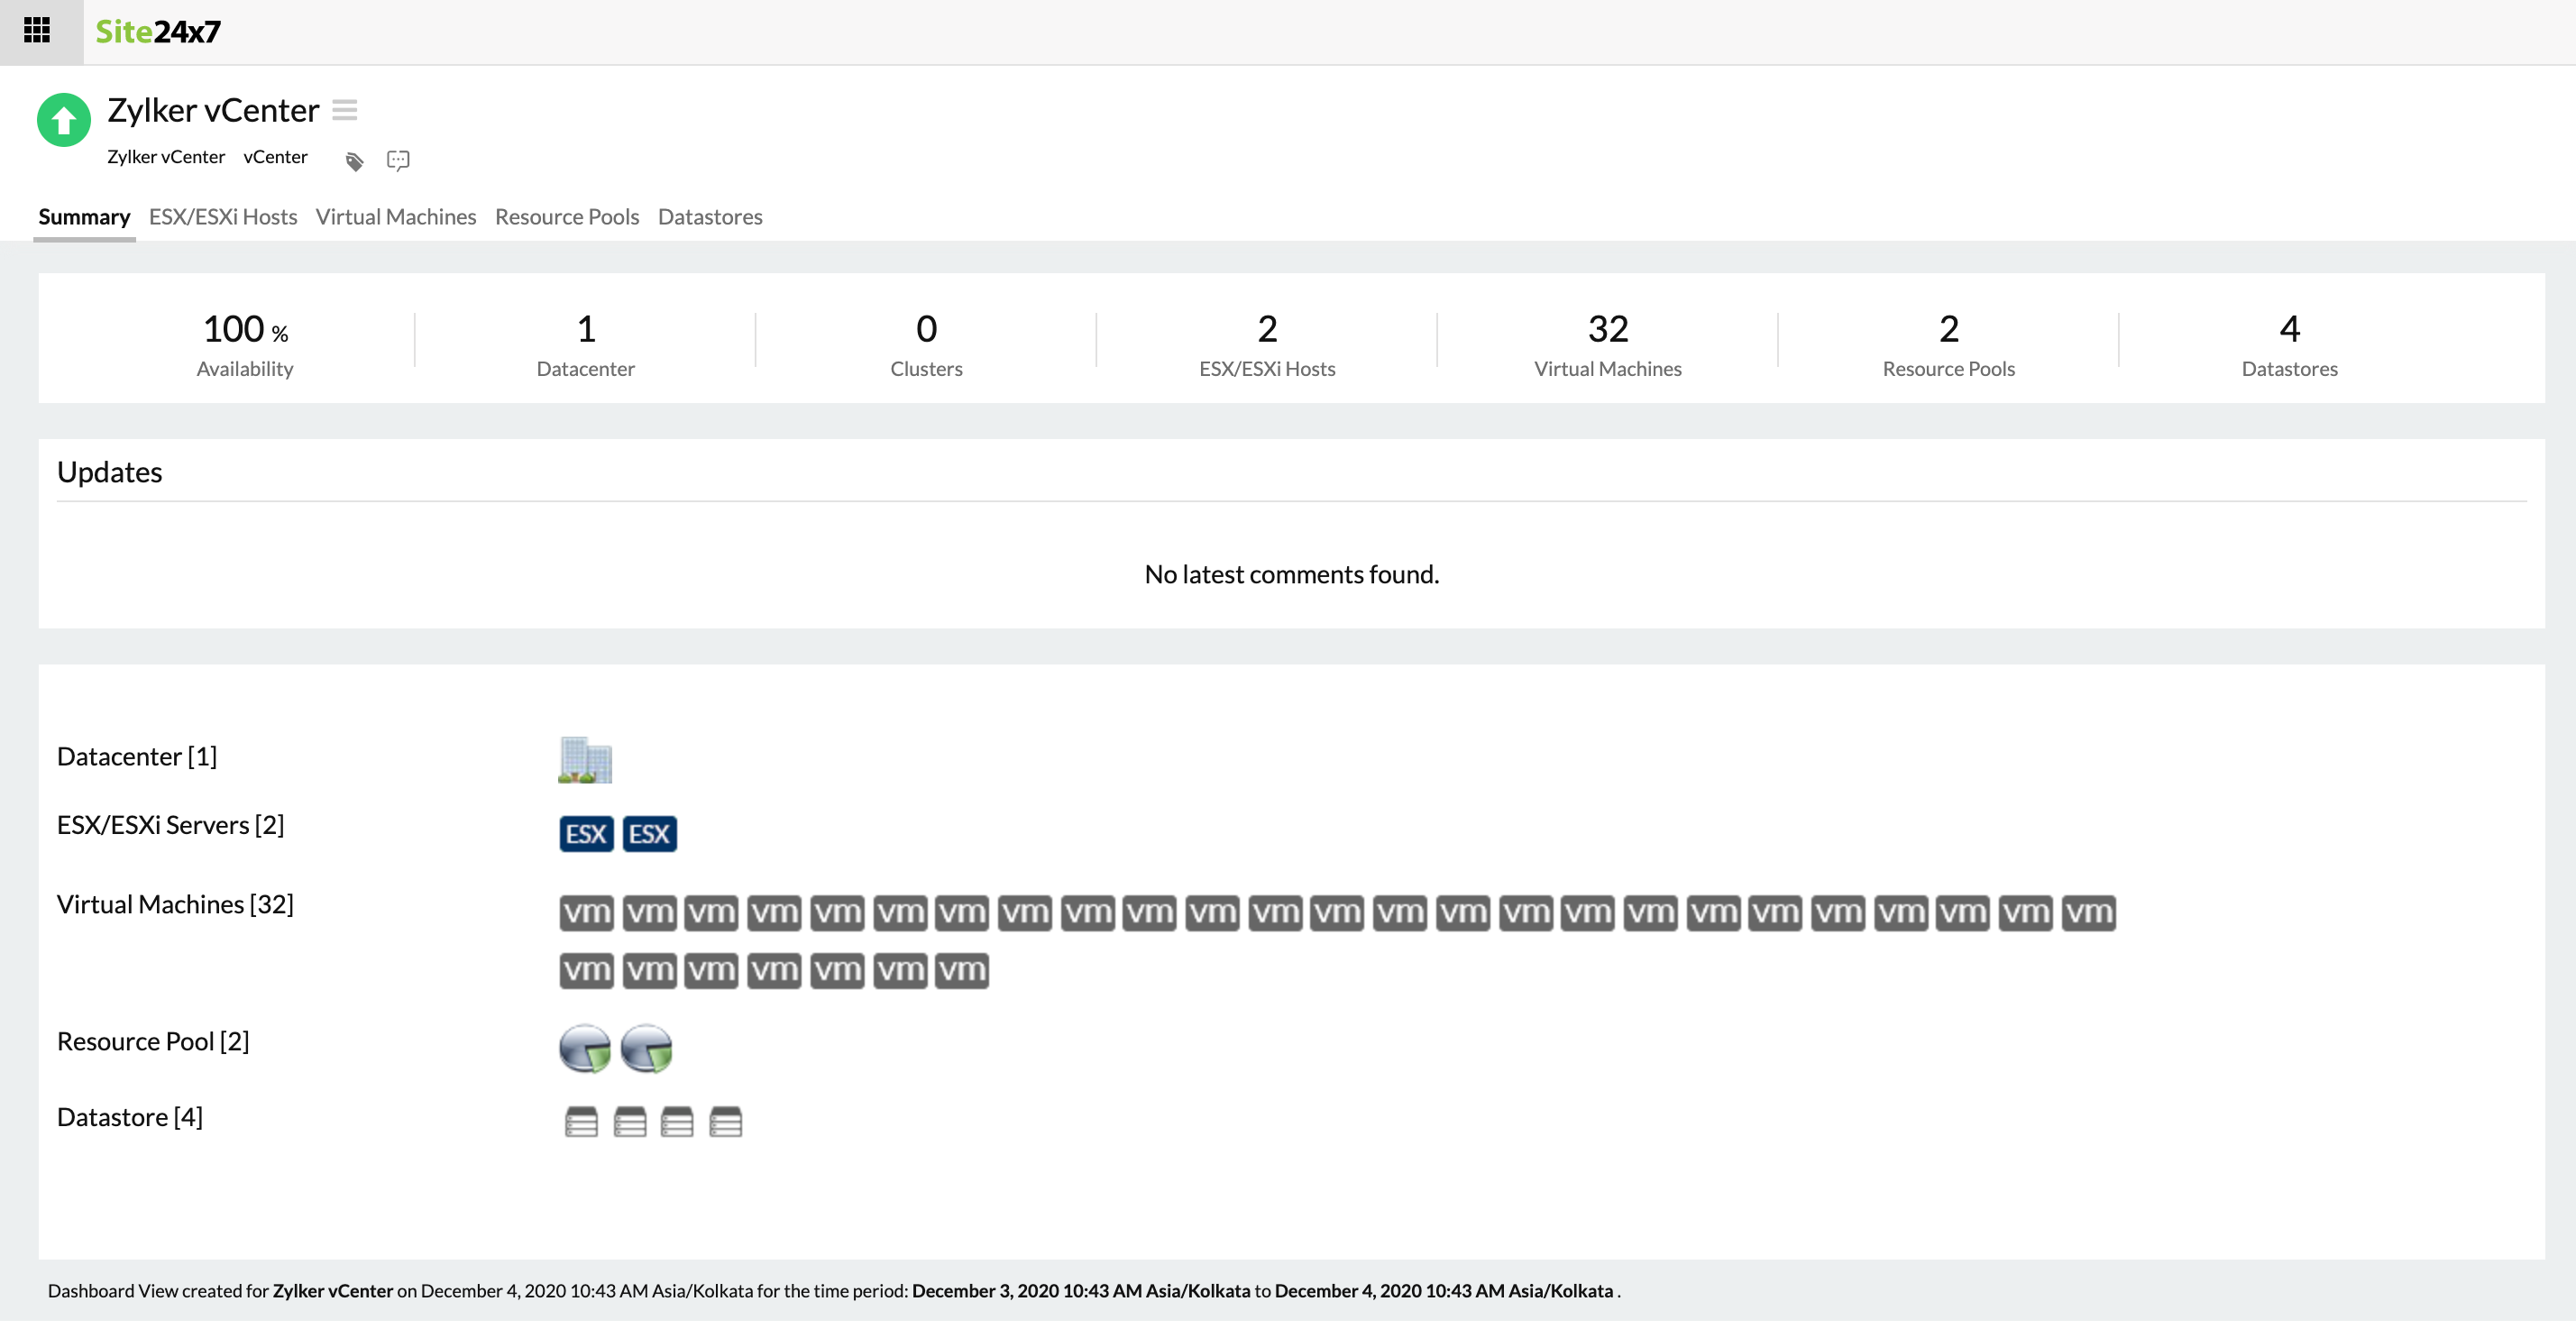
The Summary tab gives the number of associated data centers, clusters, resource pools, ESX/ESXi servers, virtual machines, and datastores configured in your vCenter server.

ESX/ESXi Hosts
This tab shows the number of ESX/ESXi servers configured in your vCenter monitor. Click the individual ESX/ESXi servers to see the detailed information regarding each server. The metrics such as availability, associated datacenter and cluster, and the number of associated virtual machines are captured here.
Virtual Machines
The number of virtual machines in your vCenter server is displayed. All the VMs available under the vCenter server will be shown here. Click the individual virtual machines to get the detailed information of each virtual machine.
Resource Pools
This tab displays the list of all associated resource pools, along with the cluster, data center, and ESX/ESXi host details. Click on an individual resource pool to obtain detailed performance insights.
Datastores
This tab displays the list of all associated datastores, along with the cluster and data center details. Click on an individual datastore to obtain detailed performance insights.
