Performance Metrics of VMware Datastore Monitors
VMware datastores are monitored based on the parameters and attributes listed below. These attributes provide detailed information about the functions of a VMware datastore and, in turn, shed light on the virtual machines that use these datastores. Inside the datastore dashboard, there are different tabs for summary, storage, latency, outages, inventory, and log report, which give in-depth information about various datastore metrics.
In this doc, we'll cover:
- Basic datastore metrics
- Metrics of VMs that occupy datastores
- Datastore summary
- Space metrics forecast
- Storage metrics
- Latency metrics
- Snapshot metrics
- VMware tags
| Metrics | Description |
| Free space (GB) | The free space in the datastore |
| Used space (GB) | The used space in the datastore |
| Capacity (GB) | The datastore's capacity |
| Snapshots (GB) | The space occupied by snapshots in the datastore |
| Swap file space (GB) | The space occupied by swap files in the datastore |
| Disk file space (GB) | The space occupied by disk files in the datastore |
| Log file size (KB) | The amount of space occupied by each VM in the form of log files |
The metrics of virtual machines that occupy datastores are as follows:
| Metrics | Description |
| Space occupied (GB) | Space occupied by the VM in the datastore |
| Space allocated (GB) | Space allocated for the VM in the datastore |
| Space available (GB) | Space available for the VM in the datastore |
| Read latency (ms) | The average time taken for the VM to read from the datastore |
| Write latency (ms) | The average time taken for the VM to write to the datastore |
| Read rate (kbps) | The rate at which data is read from the datastore |
| Write rate (kbps) | The rate at which data is written to the datastore |
| Log file details (KB) | Name and the space occupied by the respective log file |
| Average read requests per second | The total number of read operations that take place in a datastore |
| Average write requests per second | The total number of write operations that take place in a datastore |
| Log file size (KB) | The amount of space occupied by each VM in the form of log files |
Datastore summary tab
The summary tab shows the availability, free space, capacity, LUN count, and downtimes on the top band. Space distribution is shown as a pie chart with metrics like snapshots, swap files, disk files, other VMs space, other space, and free space. You can also view graph that show the log file size of virtual machines. All the virtual machines are listed here with details if they are monitored or not. You can also view your LUN and VMware ESX/ESXi details.
It is essential to refresh all the storage related information including free space, capacity, and usage of VMs regularly. By default, the refresh rate is set at 180 minutes. Data refresh can be done in one of the following ways:
- Use the Refresh Now option available in the Datastore Storage Object section in the Summary tab.
- Update the value in the VMWARE_DISCOVERY_FREQUENCY key available in the
<Site24x7 Poller_installed_directory>/conf/vmware_monitoring.conf file.
After updating the value, restart the Poller to update the refresh rate period. If you do not wish to set a refresh rate, set the key value to zero.
Forecast datastore space metrics
View AI-based predictions for datastore space metrics like diskfile space, snapshots space, and occupied space. You can view the predictions for next seven days based on historical data. These predictions allow you to plan and take remedial actions well in advance of issues. You can predict a full disk a week in advance and clear disk files. Similarly you can also clear the snapshots and know what will the occupied space be after seven days.

Storage tab
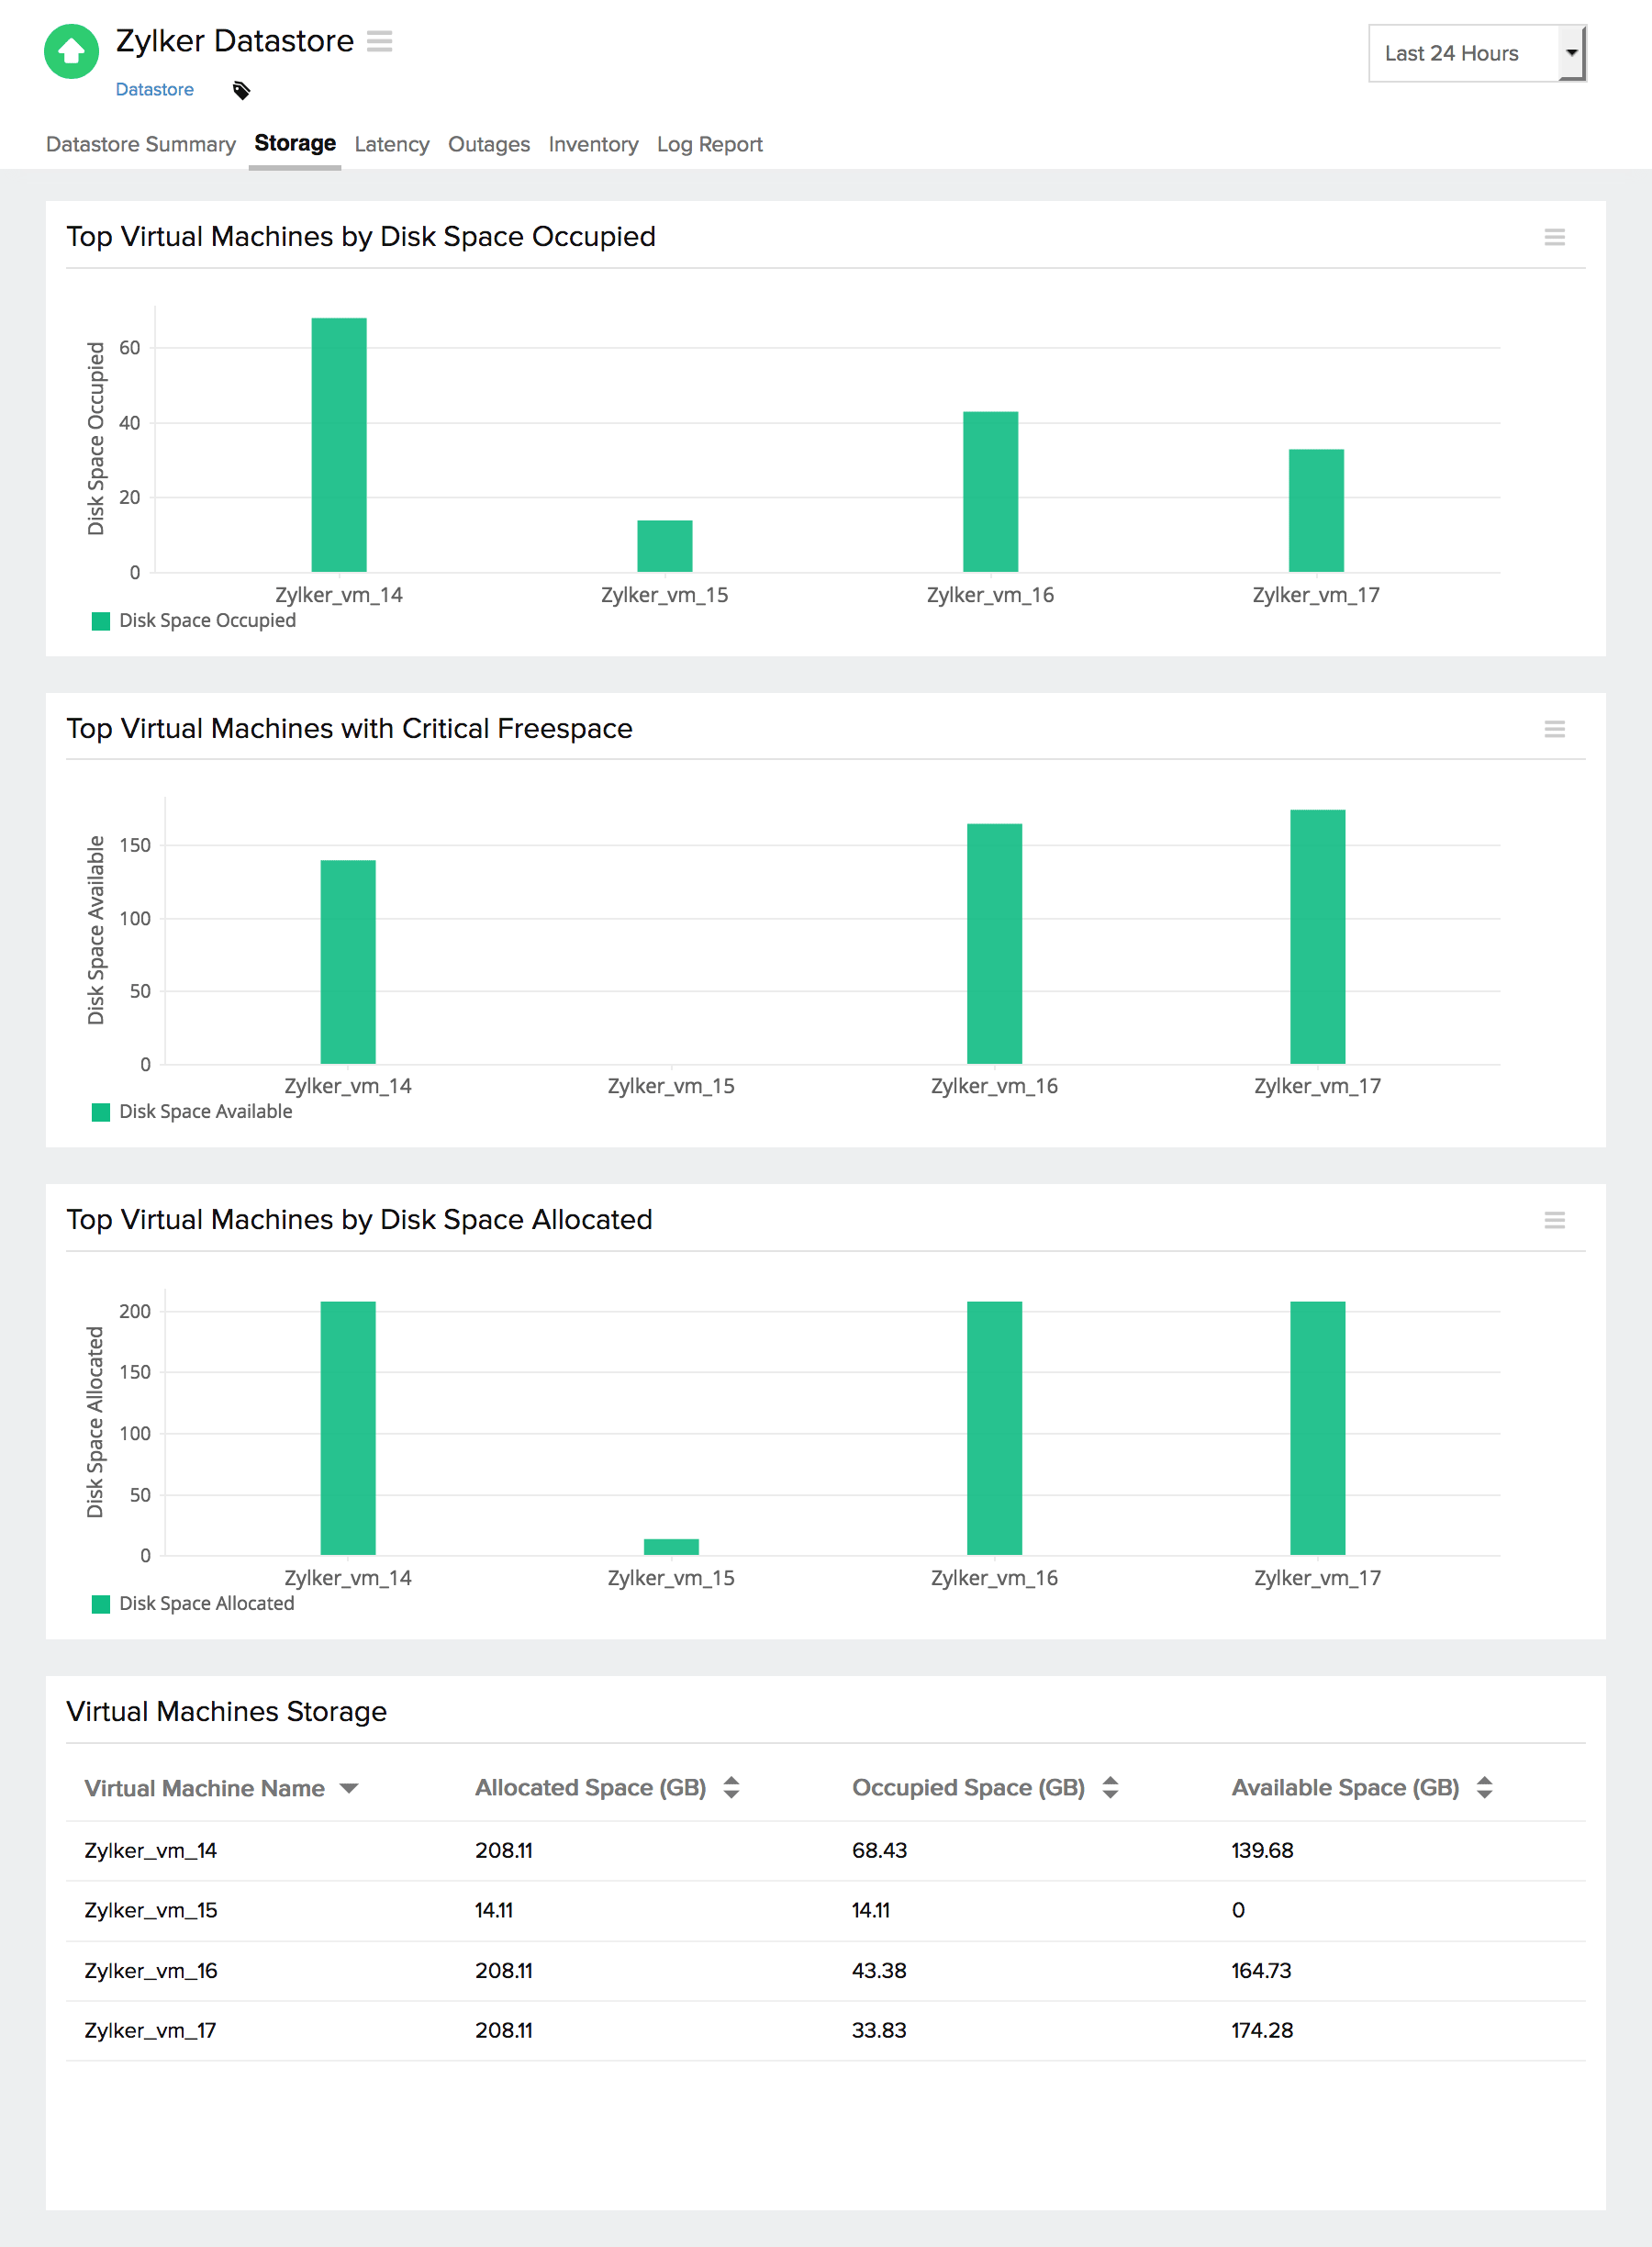
This tab gives a quick overview of virtual machine storage. You can view the allocated space, occupied space, and available space in the datastore for each virtual machine.

Latency tab
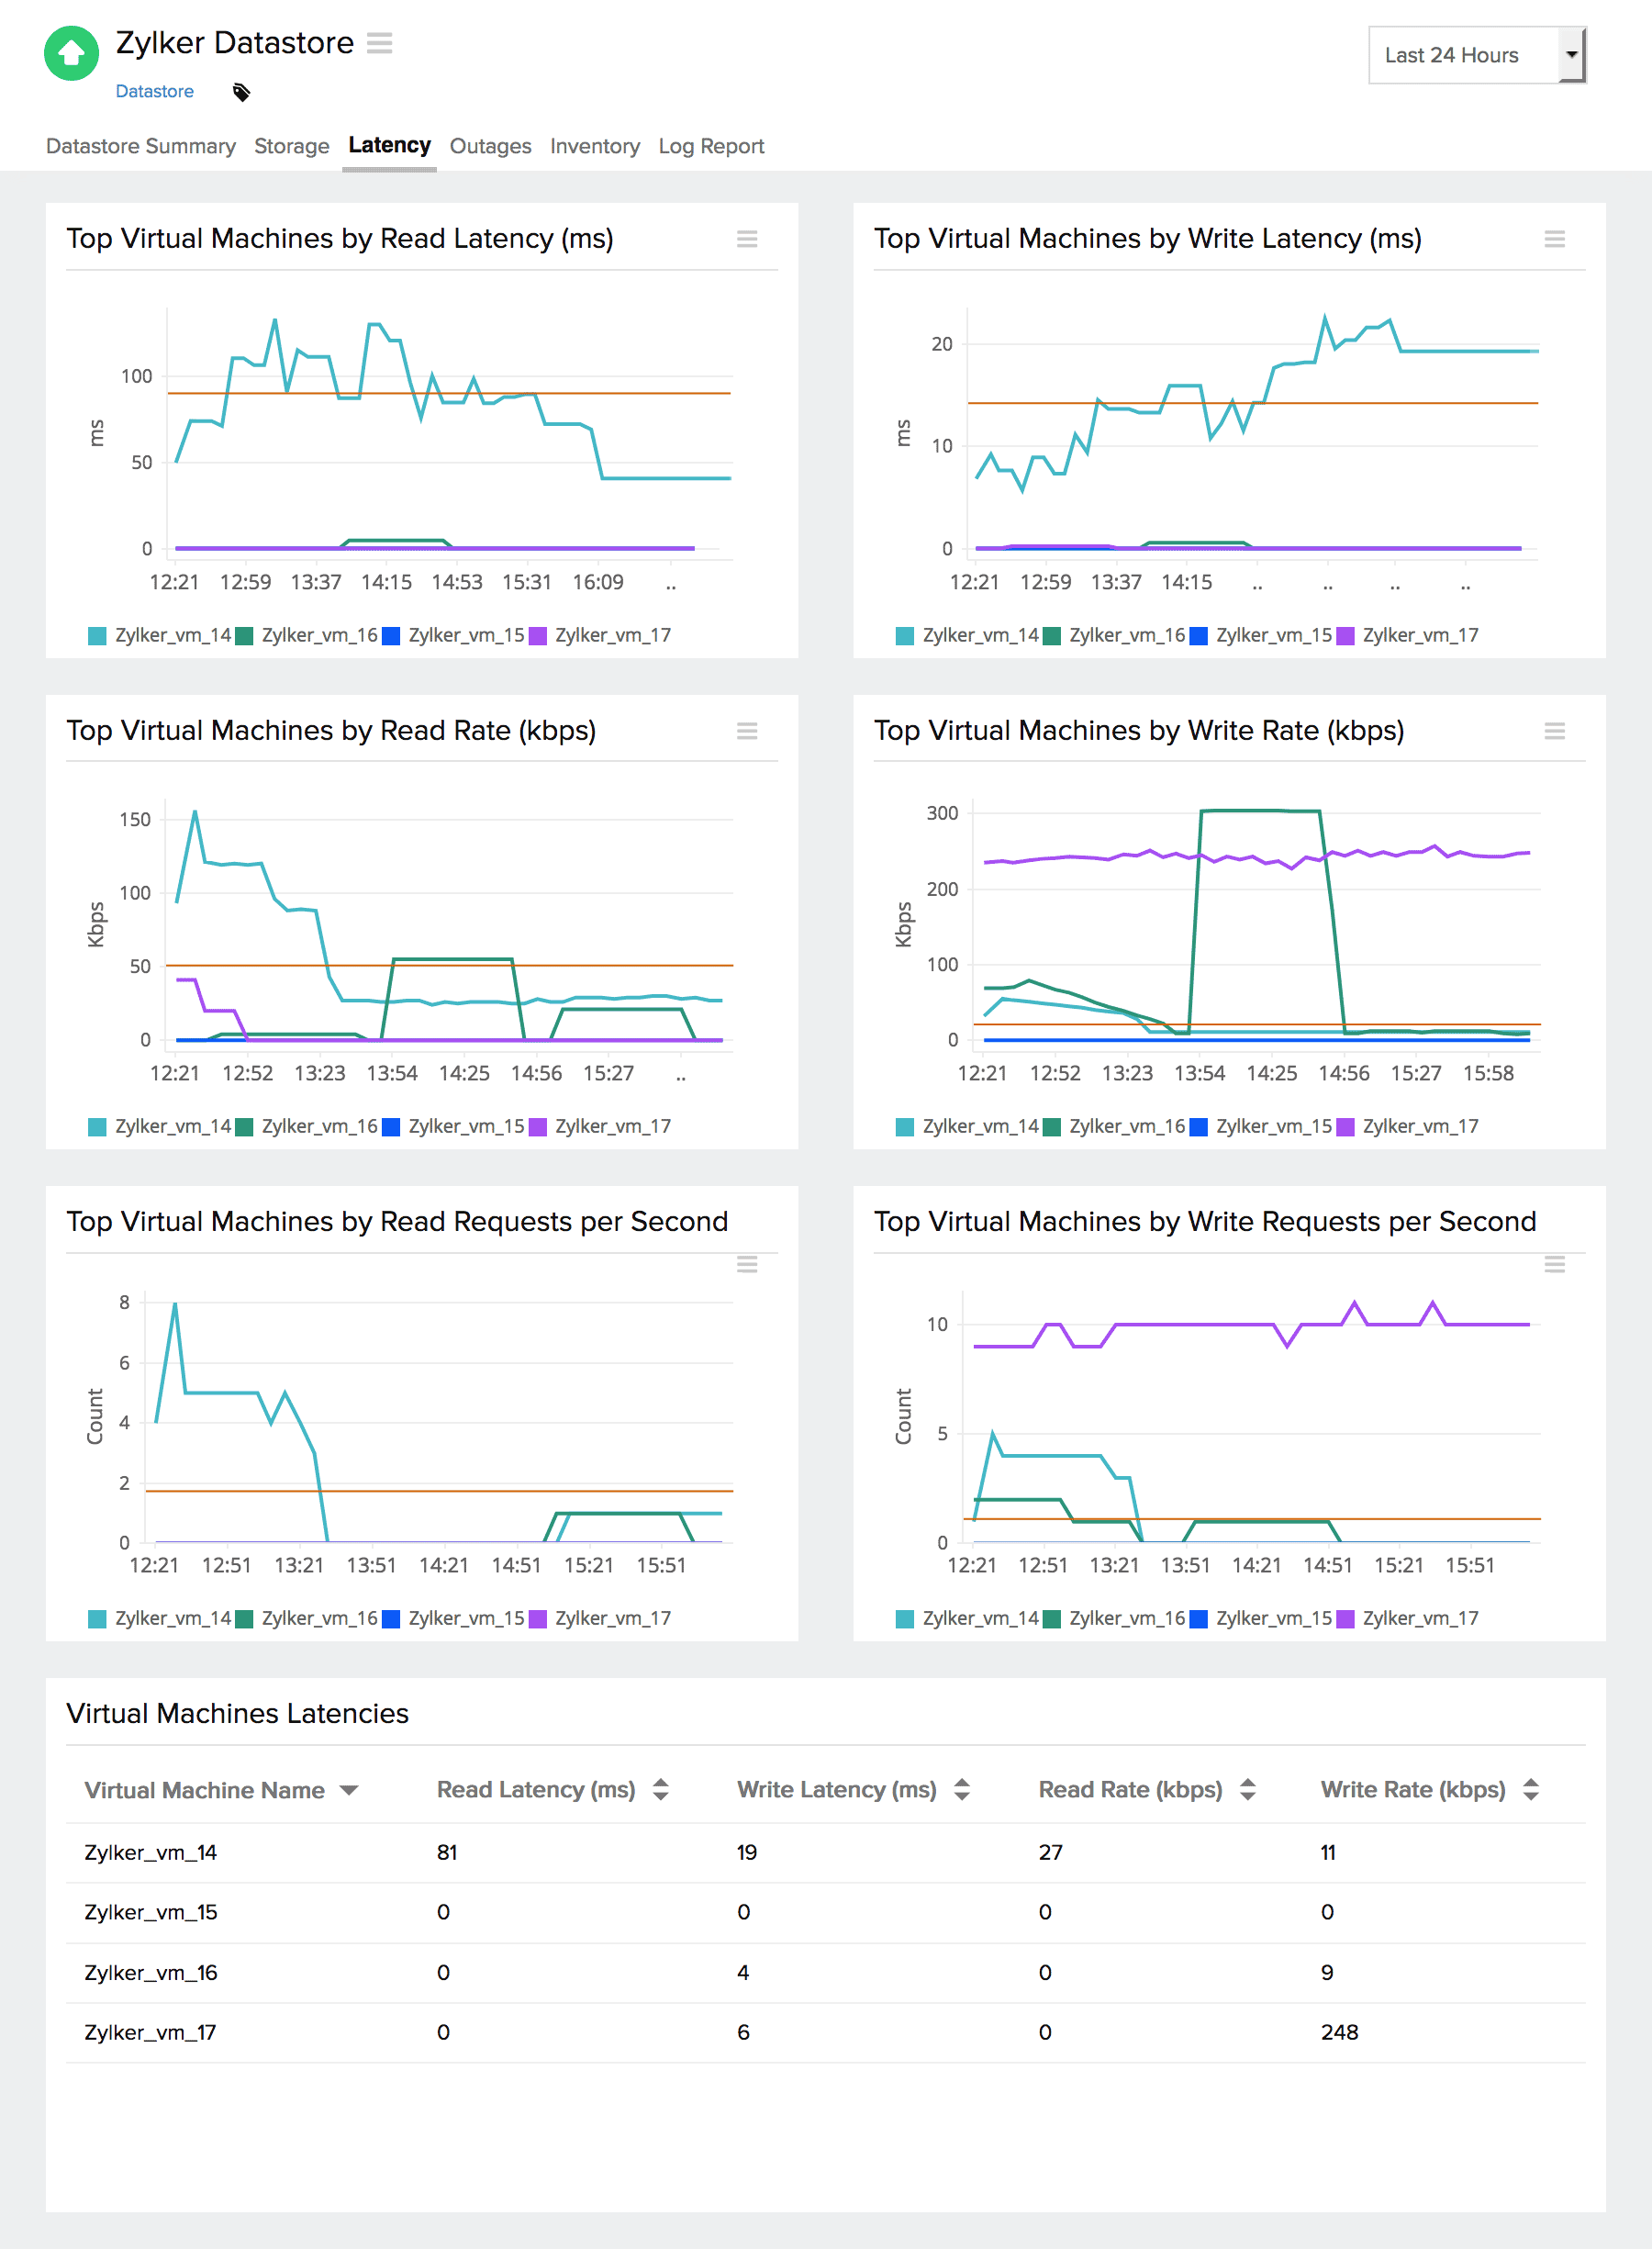
This tab gives a quick overview of virtual machine latency. The read rate, write rate, read latency, write latency, average read requests per second, and average write requests per second of each virtual machine is shown.

Snapshots tab
Add all the snapshots associated with your datastore for monitoring so that you can effectively manage your space requirements. Click Enable in the Datastore > Snapshots tab to start monitoring your snapshots. You can monitor snapshots with detailed performance metrics.
Once added, this tab will look like:

VMware tags
View the custom tags created in your VMware environment with Site24x7. It automatically identifies, fetches, and syncs the tags associated with the device of the VMware user and displays them in the VMware module across ESX/ ESXi hosts, virtual machines, and datastores. Site24x7 revises the tags frequently and makes it hassle-free for users to handle.
