Performance Metrics of VMware Snapshot Monitors
Snapshot performance is monitored based on the snapshot's size and age. As snapshots increase in number and age, they add an unnecessary load on datastores, slowing down the performance of virtual machines (VMs). This is why it's ideal to keep the number of snapshots low and clear old backup files, retaining only those that are important.
Here's a peek at how Site24x7 monitors snapshots once they're added for monitoring. You can also configure threshold limits for all these performance metrics at both the parent and individual snapshot level.
In this doc, we'll cover:
To view the performance metrics of a snapshot monitor, log in to your Site24x7 account, navigate to VMware > Datastore Snapshot, and click a Snapshot name.
Summary
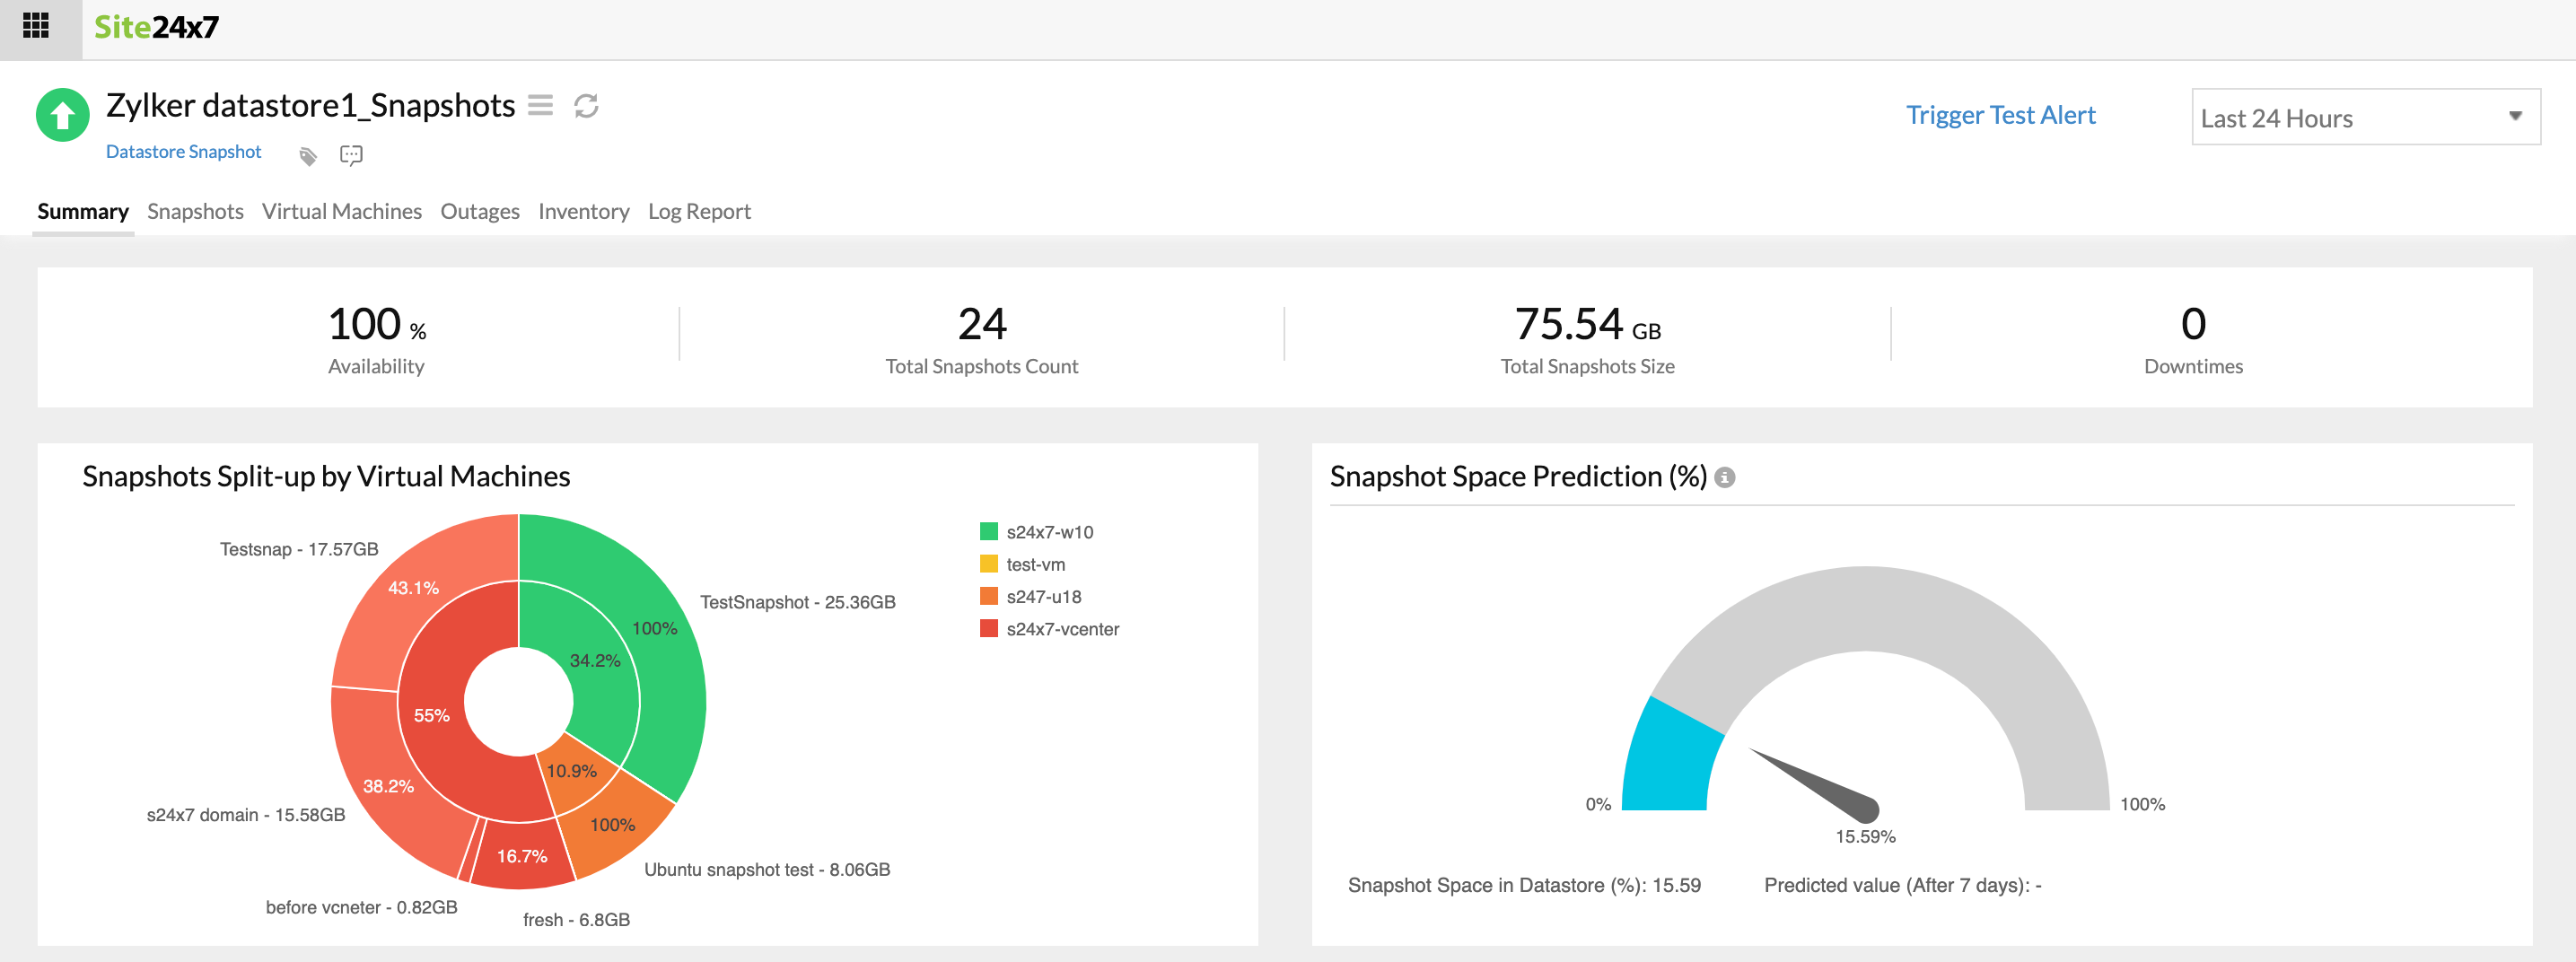
You can obtain a summary of the availability of snapshots, the total number of snapshots, the space they occupy, and downtime details.
-
Snapshot split-up by VMs
View a split-up of snapshots, categorized VM-wise, from this chart. You can also obtain the percent of space each snapshot occupies in the total space allocated to snapshots.
-
AI-powered snapshot space prediction
View what percentage of datastore space your snapshots will occupy after seven days using AI-powered insights. With these predictions, you can plan the growth rate of your snapshots, and clear them as needed.

-
Snapshot details
View a consolidated list of all snapshots in your datastore along with their description, associated VM name, time of creation, size, and age. You can also configure threshold limits for the age and size of all individual snapshots, and receive alerts when the limits are breached.
Snapshot metrics
-
Snapshots tree view
This view displays the hierarchy of VMs and the snapshots associated with them.
Each node of the tree indicates a VM. When you click on one, it expands to display the snapshots.
Once you click on a VM, you can view the number of snapshots, their size, and the names of the biggest and the oldest snapshots on the right side. Similarly, when you click a snapshot, you can view its name, description, age, and size.

-
Top snapshots
You can view the top snapshots based on size and age from here. You can also obtain a trend chart for the size of snapshots over the chosen period.
VM metrics
Obtain snapshot performance metrics at the VM level that affect a VM's performance from this tab.
-
Virtual machines storage details
View a complete list of all VMs with snapshots in the associated datastore. View information on how much space snapshots occupy in a particular VM along with the number of snapshots per VM.
-
Top VMs and snapshot size trend
You can view the following graphs.
| Graph | Description |
|---|---|
| Top VMs by Snapshot Count | VMs that have the maximum number of snapshots |
| Top VMs by Snapshot Size | VMs with snapshots that consume more space |
| Snapshots Count Trend by Virtual Machines | The trend of the number of snapshots over a period |
| Snapshots Size Trend by Virtual Machines | The trend of snapshot size over a period |
You can also view the outage details, inventory details, and log report.
Related articles
-
On this page
- Summary
- Snapshot metrics
- VM metrics
- Related articles
