VPN Monitoring
VPN monitoring is the process of tracking different connections, paths, and tunnels using various performance metrics to ensure that your private network is safe from intruders. Proper monitoring ensures that the data transferred through your network is encrypted and the rate of transmission and receipt is optimal. Monitoring an ISP's bandwidth usage to ensure VPN connectivity is also important. Site24x7 with its device templates and performance counters provides comprehensive monitoring to stay on top of your VPN.
Prerequisites
- Install an On-Premise Poller within the network you want to monitor. Both Windows and Linux versions are supported. Ensure the On-Premise Poller is running version 6.7.5 or higher.
- The device should support SNMP.
System requirements
| Number of devices/interfaces | Processor | RAM | Hard disk |
| Upto 100 devices/1000 interfaces | 4 processors | 8GB | 60GB or higher |
| 100-500 devices/1000 to 2500 interfaces | 8 processors | 16GB |
Vendor support
By default, Site24x7 supports common network security appliances, like FortiGate, Cisco, and WatchGuard firewalls. Additionally, you can monitor the performance of any SNMP device from any vendor using custom performance counters.
- Palo Alto Networks
- ZyXEL
- Barracuda
- TopSec
- NetScreen Technologies
- Check Point
- Juniper Networks
- Huawei
Adding your VPN device for monitoring
- Log in to your Site24x7 account.
- Go to Admin > Inventory > Add Monitor.
- On the Add Monitor page, click Add VPN under Network.
- On-Premise Poller: The first step in adding a network device is to choose an On-Premise Poller. You can choose an On-Premise Poller from the list or install a new one. Click Next.
NoteNetwork Module should be enabled in the On-Premise Poller that you choose. If not, enable it.
- Credentials: Credentials help Site24x7 communicate via SNMP and fetch data for monitoring. Select proper credentials according to your SNMP version, or add new credentials. Click Next.
- Details: Enter the following details and click Next.
- Display name: Enter a display name to identify your device.
- Device name/IP address: List your device's host name or IP address.
- Interface filters: Create a network discovery rule (when adding a device for the first time) or select from the existing list of network discovery rules.
- Rule Name: A unique name to identify the rule with.
- Description: Define the nature of the discovery rule.
- Interface type(s): Choose the type of interface from the drop-down menu.
- Admin state: Define the admin state of the interfaces to be added for monitoring.
- Operational state: Select the operational state of the interface for it should be added for monitoring.
- Click Save Rule.
- Then, click Next.
- Recheck your entries and click Discover.
Adding the entire VPN for monitoring
Follow the steps below to add a network for monitoring:
- Follow the steps 1-5 above.
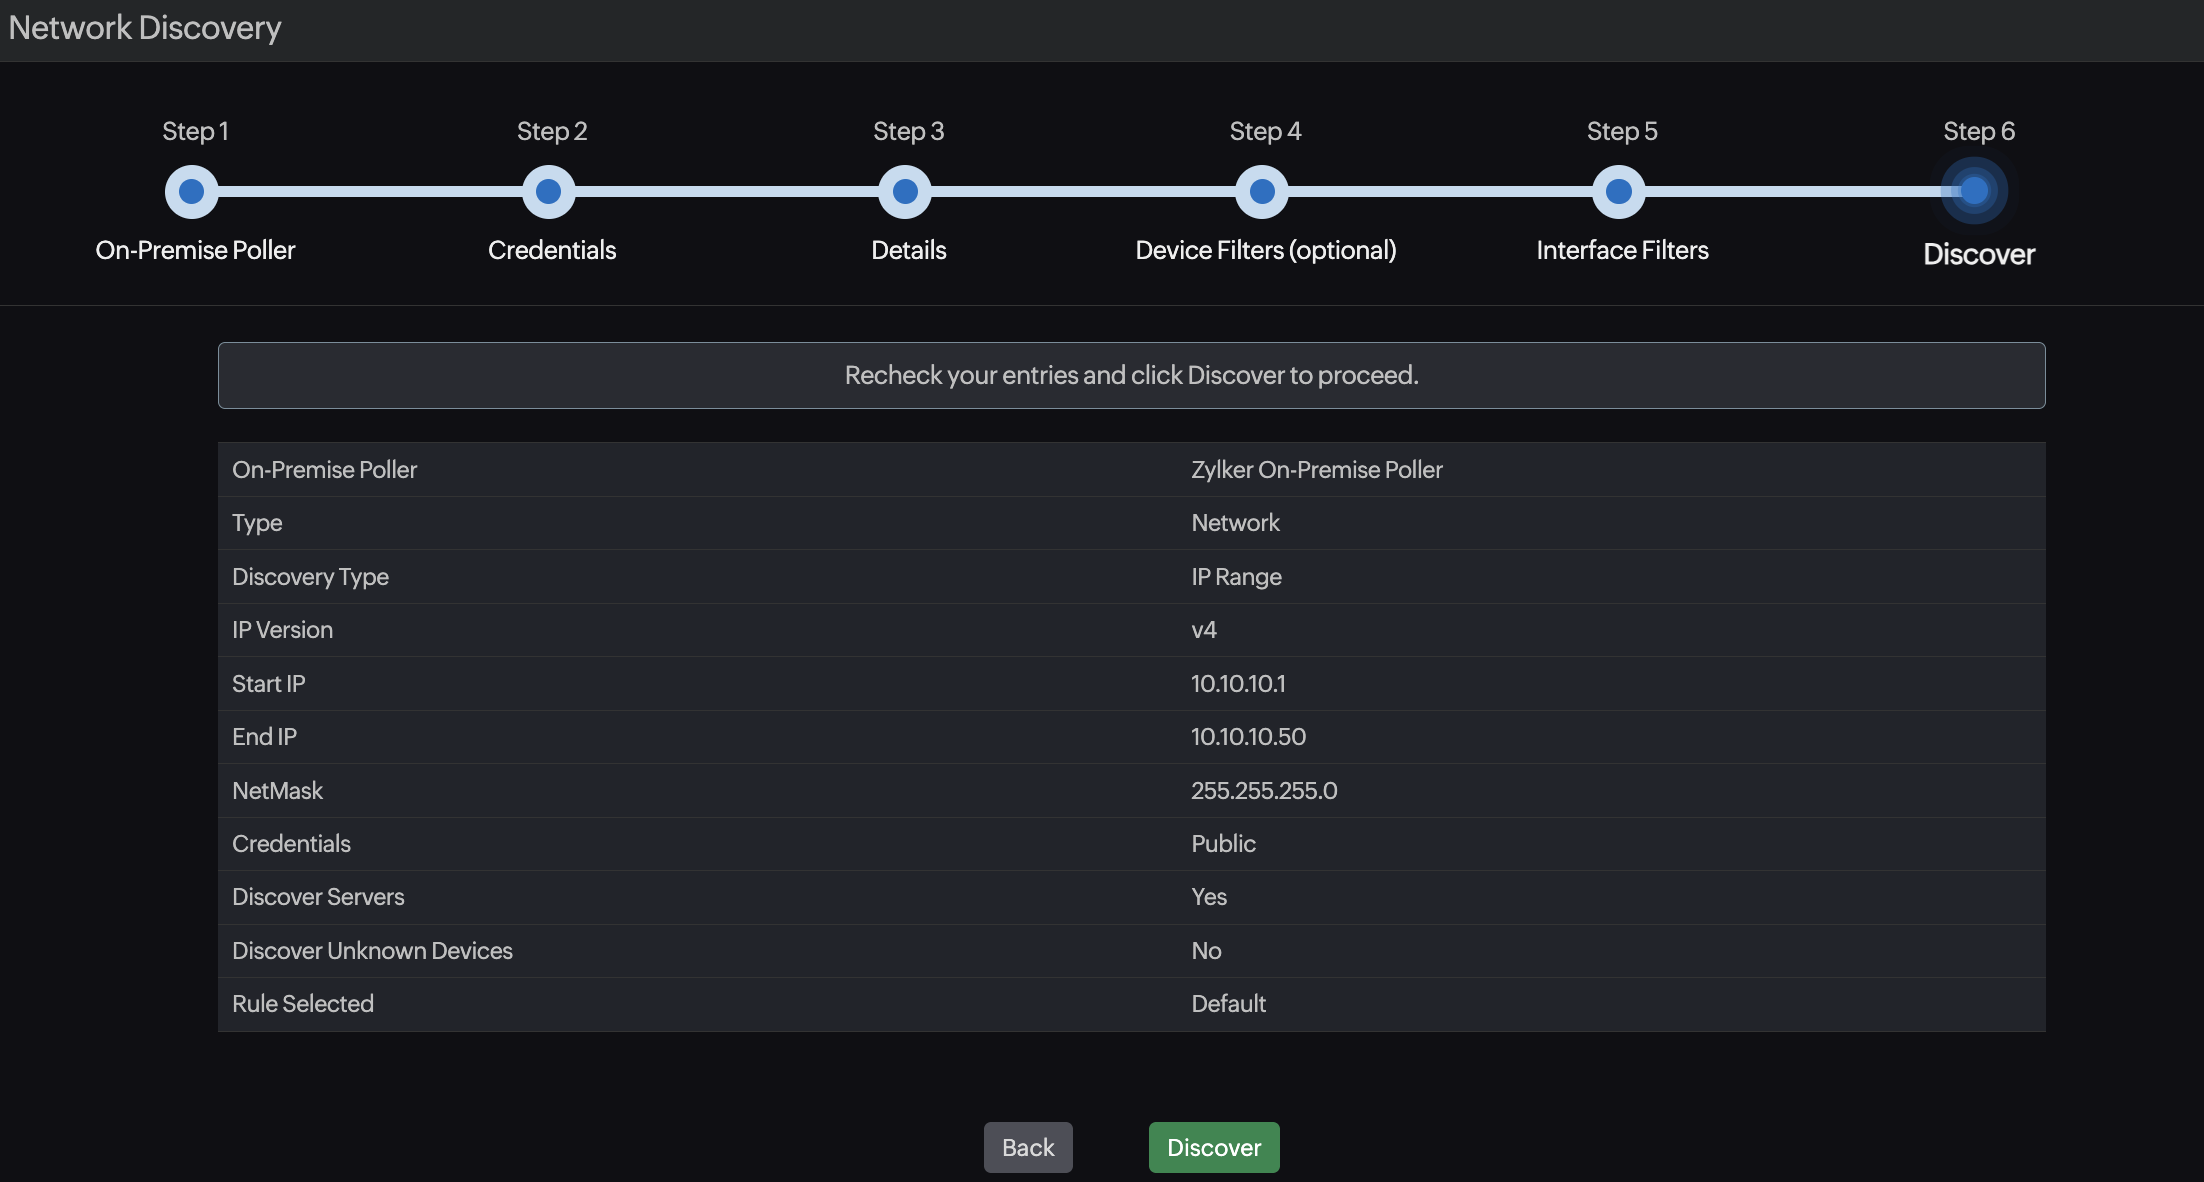
- Details: Enter the following details and click Next.
- Discovery Mode: Select Add Network.
- Discovery Type: Select Use IP Range or Use CIDR.
- Enter the following details to discover a network using an IP range:
- IP type: Choose either IPv4 or IPv6.
- Start IP: Enter the start IP.
- End IP: Enter the end IP.
- NetMask: Enter the NetMask.
- Enter the following details to discover a network using CIDR:
- IP type: Choose either IPv4 or IPv6.
- Start IP: Enter the start IP.
- Mask Bit: Enter the Mask Bit.
- Filter Devices: Add filters to your discovery and click Next.
- Discover Servers: Toggle Yes to discover and monitor servers within your network.
- Discover Unknown: Toggle Yes to discover and monitor devices that do not respond to your SNMP credentials.
- Discovery Action: Select Add from the drop-down menu to include devices for discovery and choose Ignore to exclude them from discovery.
- Type: Choose the type of filter from the drop-down menu. The type can be one of these: IP Range, IP Address, Category, Device Type, or Device Name.
- Condition: Set the condition as equals or contains, and enter corresponding values based on the type of filter you choose.
- Click Add to add more filters.
- Discover Servers: Toggle Yes to discover and monitor servers within your network.
- Follow step 7 given in the previous section to add interface filters
- Recheck your entries and click Discover.
Network discovery usually takes around five minutes, but that figure depends on the size of the network. If the monitor isn't listed after completing these steps, follow these troubleshooting steps.
Adding custom device templates
If default templates do not match your device requirements, you can create a custom template for your device based on your need. Navigate to Network > Device Templates. In the Device Templates screen, click Add Device Template, located at the top right corner of the screen.
Adding custom performance counters
You can add custom performance counters while adding a device template or by editing a device template.
VPN Tunnels
The VPN Tunnels tab displays all IPsec tunnels detected on the monitored firewall. It provides visibility into tunnel status, security parameters, and live traffic between locations, enabling you to diagnose connection issues and identify bandwidth congestion more quickly.
To access this feature, ensure your On-Premise Poller is running version 6.7.5 or later. This is supported for FortiGate, Cisco, and WatchGuard firewalls and Layer 3 devices.
How to perform an ICMP Ping check to check the VPN availability
- Go to Network > Network Devices.
- Click the
 icon next to a network device.
 - Click Ping.
Setting threshold limits
Add thresholds to your devices to be immediately notified when any device goes down. The monitor’s status changes to Trouble or Critical when the condition applied to any of the below threshold strategies hold true.
Setting thresholds for interfaces and performance counters
You can also set thresholds and receive alerts for interfaces and performance counters.
SNMP traps
SNMP devices can be configured to send traps to Site24x7. This is the best way to monitor the VPN tunnel flaps. When configured, the devices send traps to Site24x7, which instantly processes and sends messages to network administrators, allowing them to take immediate corrective measures.
Configuring SNMP traps
The Site24x7 On-Premise Poller listens to traps from network devices via UDP port 162.
Configure your device to send SNMP traps to the Site24x7 On-Premise Poller. This can be done in your device either by using a GUI or CLI. You can also test if your On-Premise Poller is receiving these traps.
Adding trap processors
You can create and configure trap processors from the Trap Processors view.
Trap alert mechanisms
You can configure trap alerts to notify you through email, SMS, phone call, or push notifications. You can also receive these notifications through integrated applications, including ManageEngine's Alarms One and ServiceDesk Plus, as well as third-party applications like Zapier, Slack, PagerDuty, and Microsoft Teams.
How to automate incident remediation
Stay ahead of potential problems by creating an automation profile in advance to act on a known response triggered from your devices. You can configure incident remediation based on the thresholds set and automate them using different templates.
Your automation template can be a configlet, server script, server command, and more.
Creating custom dashboards
Obtain a clear picture of your VPN with all key metrics and necessary information organized in a single view. Custom dashboards can help you to view all your key performance metrics as widgets in a dashboard. You can create a custom dashboard by following the steps given in this video:
Creating topology maps
Obtain a comprehensive view of your network with all devices arranged in a hierarchical structure. Choose a predefined map as the background or upload images of your choice and view your devices, their connections, and statuses at once.
Other types of VPN monitoring
Apart from adding a VPN for monitoring and adding a VPN device as a network device, you can also provides the flexibility to monitor using other types for non-SNMP devices.
- Monitor internal resources using PORT monitoring
- Monitor the URL of an internal resource using URL monitoring
- Integrate with VPN plugin for agent-based monitoring
Creating custom reports
Custom reports let you create personalized comparison reports for your business needs. You can compile precise metrics of your VPN monitor for specified time periods to generate a single easy-to-comprehend report. All required metrics are listed here for quick analysis and troubleshooting.
Add users/contact and customize alert settings
Set up other users who can log in to Site24x7, individually customize the way each contact interacts with the Site24x7 account, and receive notifications about outages.
How to analyze device alert emails
A device down or critical alert email will be triggered, with the device name and status as the subject, along with the location. The body of the email contains the device IP, which is the primary reason for the failure. With the details of the last poll, the alert email conveys all that is required for a network administrator to essentially understand what has happened to a particular device and when.
This mail also provides charts on the performance report for the past 24 hours, along with the availability summary report for the last three days. This is to understand if that particular device was down or had some issues in the recent past.
How to analyze trap alert emails
 These are similar to device alert emails, wherein the status—down or critical — is decided based on the configured thresholds. This will also display the primary reason for failure, with the processed trap message replacing the existing threshold failure. Network admins can also analyze the availability summary report for the past three days.
One special aspect about these trap alert mails is that they also provide the recent five processed trap messages for analysis and understanding.
Interpret custom reports
The custom report illustrates and renders the compared data in a tabular format. Learn how to interpret a custom report.
Mobile app
The Site24x7 mobile app is designed to monitor resources on the go. The app provides real-time alerts on your mobile device when a performance problem occurs on your technology stack.
Download the iOS | Android apps to receive real-time alerts and push notifications, right on your device.
Troubleshooting tips
- Using MIB browser
- Checking the SNMP reachability using the MIB browser
- How to find the Device Identifier (sysOID) using the MIB browser?
- Troubleshooting steps if the network devices are being discovered as unknown or show a configuration error
- How to test if Site24x7 On-Premise Poller is receiving traps?
-
On this page
- Prerequisites
- System requirements
- Vendor support
- Adding your VPN device for monitoring
- Adding the entire VPN for monitoring
- Adding custom device templates
- Adding custom performance counters
- VPN Tunnels
- Performing an ICMP Ping check to check the VPN availability
- Setting thresholds
- SNMP Traps
- Automating incident remediation
- Creating custom dashboards
- Creating topology maps
- Other types of VPN monitoring
- Creating custom reports
- Adding users/contact and customizing alert settings
- Analyzing device alert emails
- Analyzing trap alert emails
- Interpreting custom reports
- Mobile app
- Troubleshooting tips