Performance Metrics of APM Insight
Monitoring your applications using Site24x7 APM Insight, an application performance monitoring tool, allows you to track and measure important metrics, including Apdex score, app server throughput, response time, exceptions, and more, from a customizable and unified console.
View performance metrics
To begin
- Log in to the Site24x7 web client.
- Navigate to APM > APM Insight > Applications.
- Click the application for which you want to view the metrics.
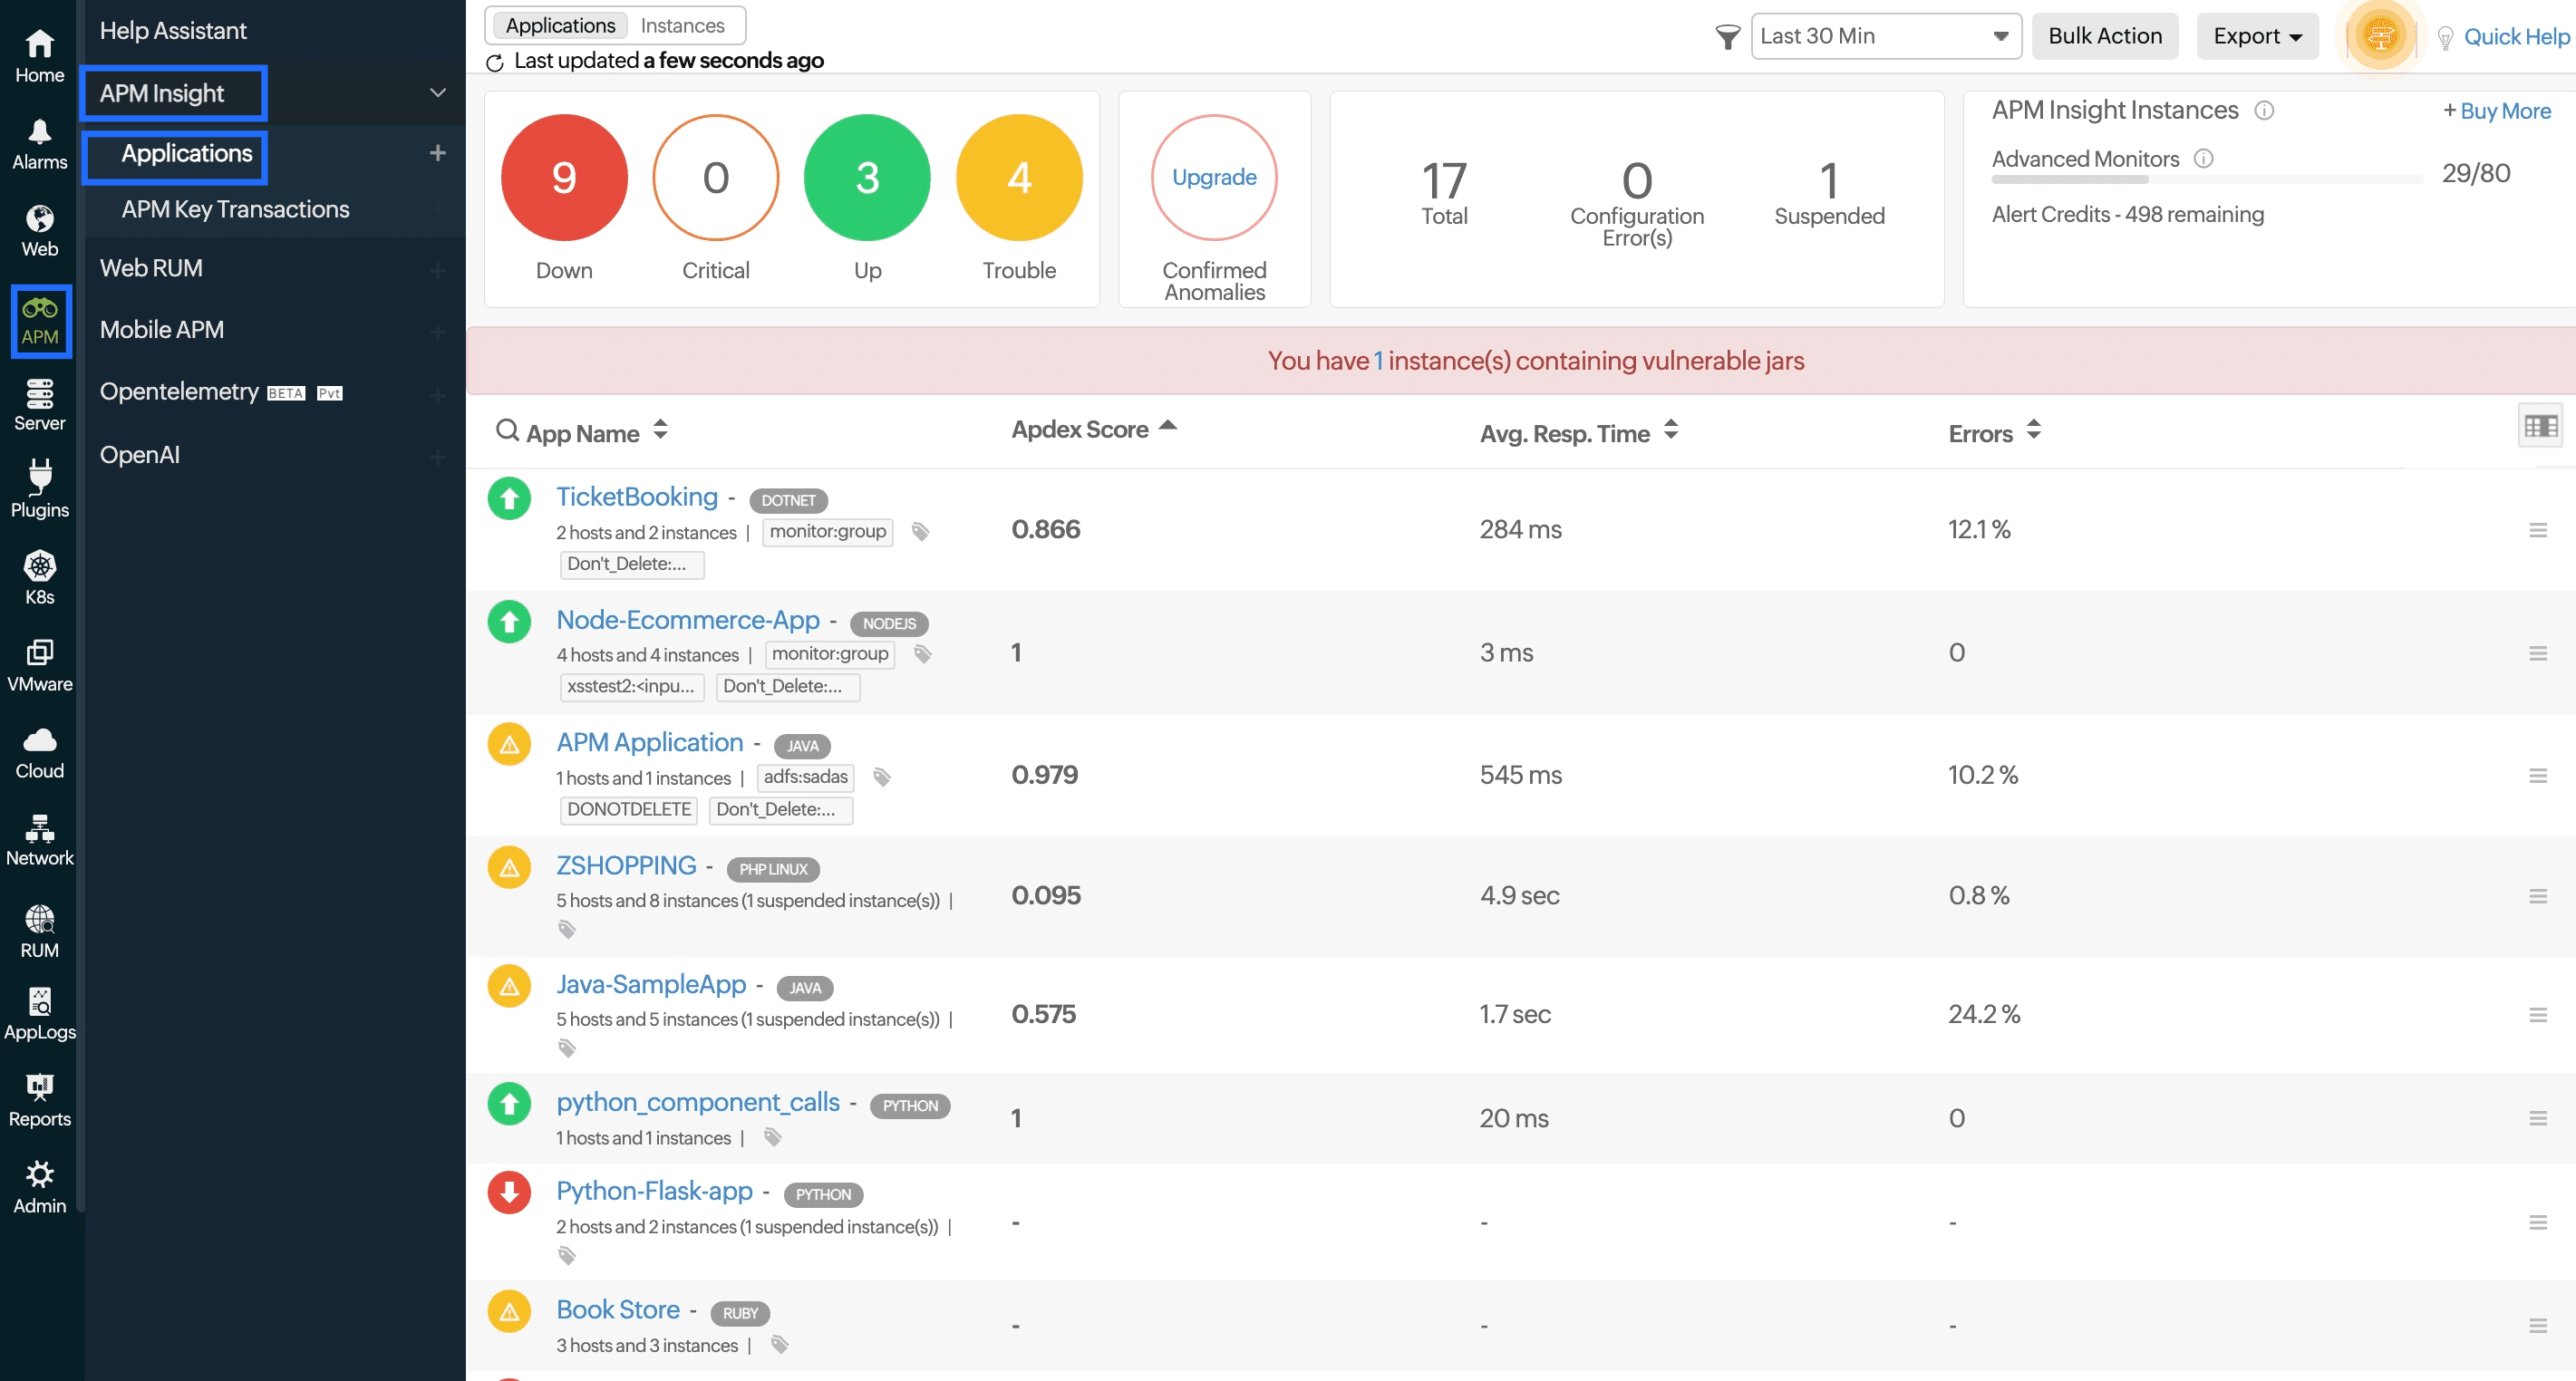
- In the right corner, you can decide on the time frame for which you need the metrics.
- Click the hamburger icon (
 ) located next to the Application/Instances drop-down to perform various actions, such as edit the configurations, setting milestones, associate a RUM application, suspending/deleting the instance, copying the web script, and exporting the metrics as a PDF.
Various parameters and metrics can be obtained by accessing the following tabs:
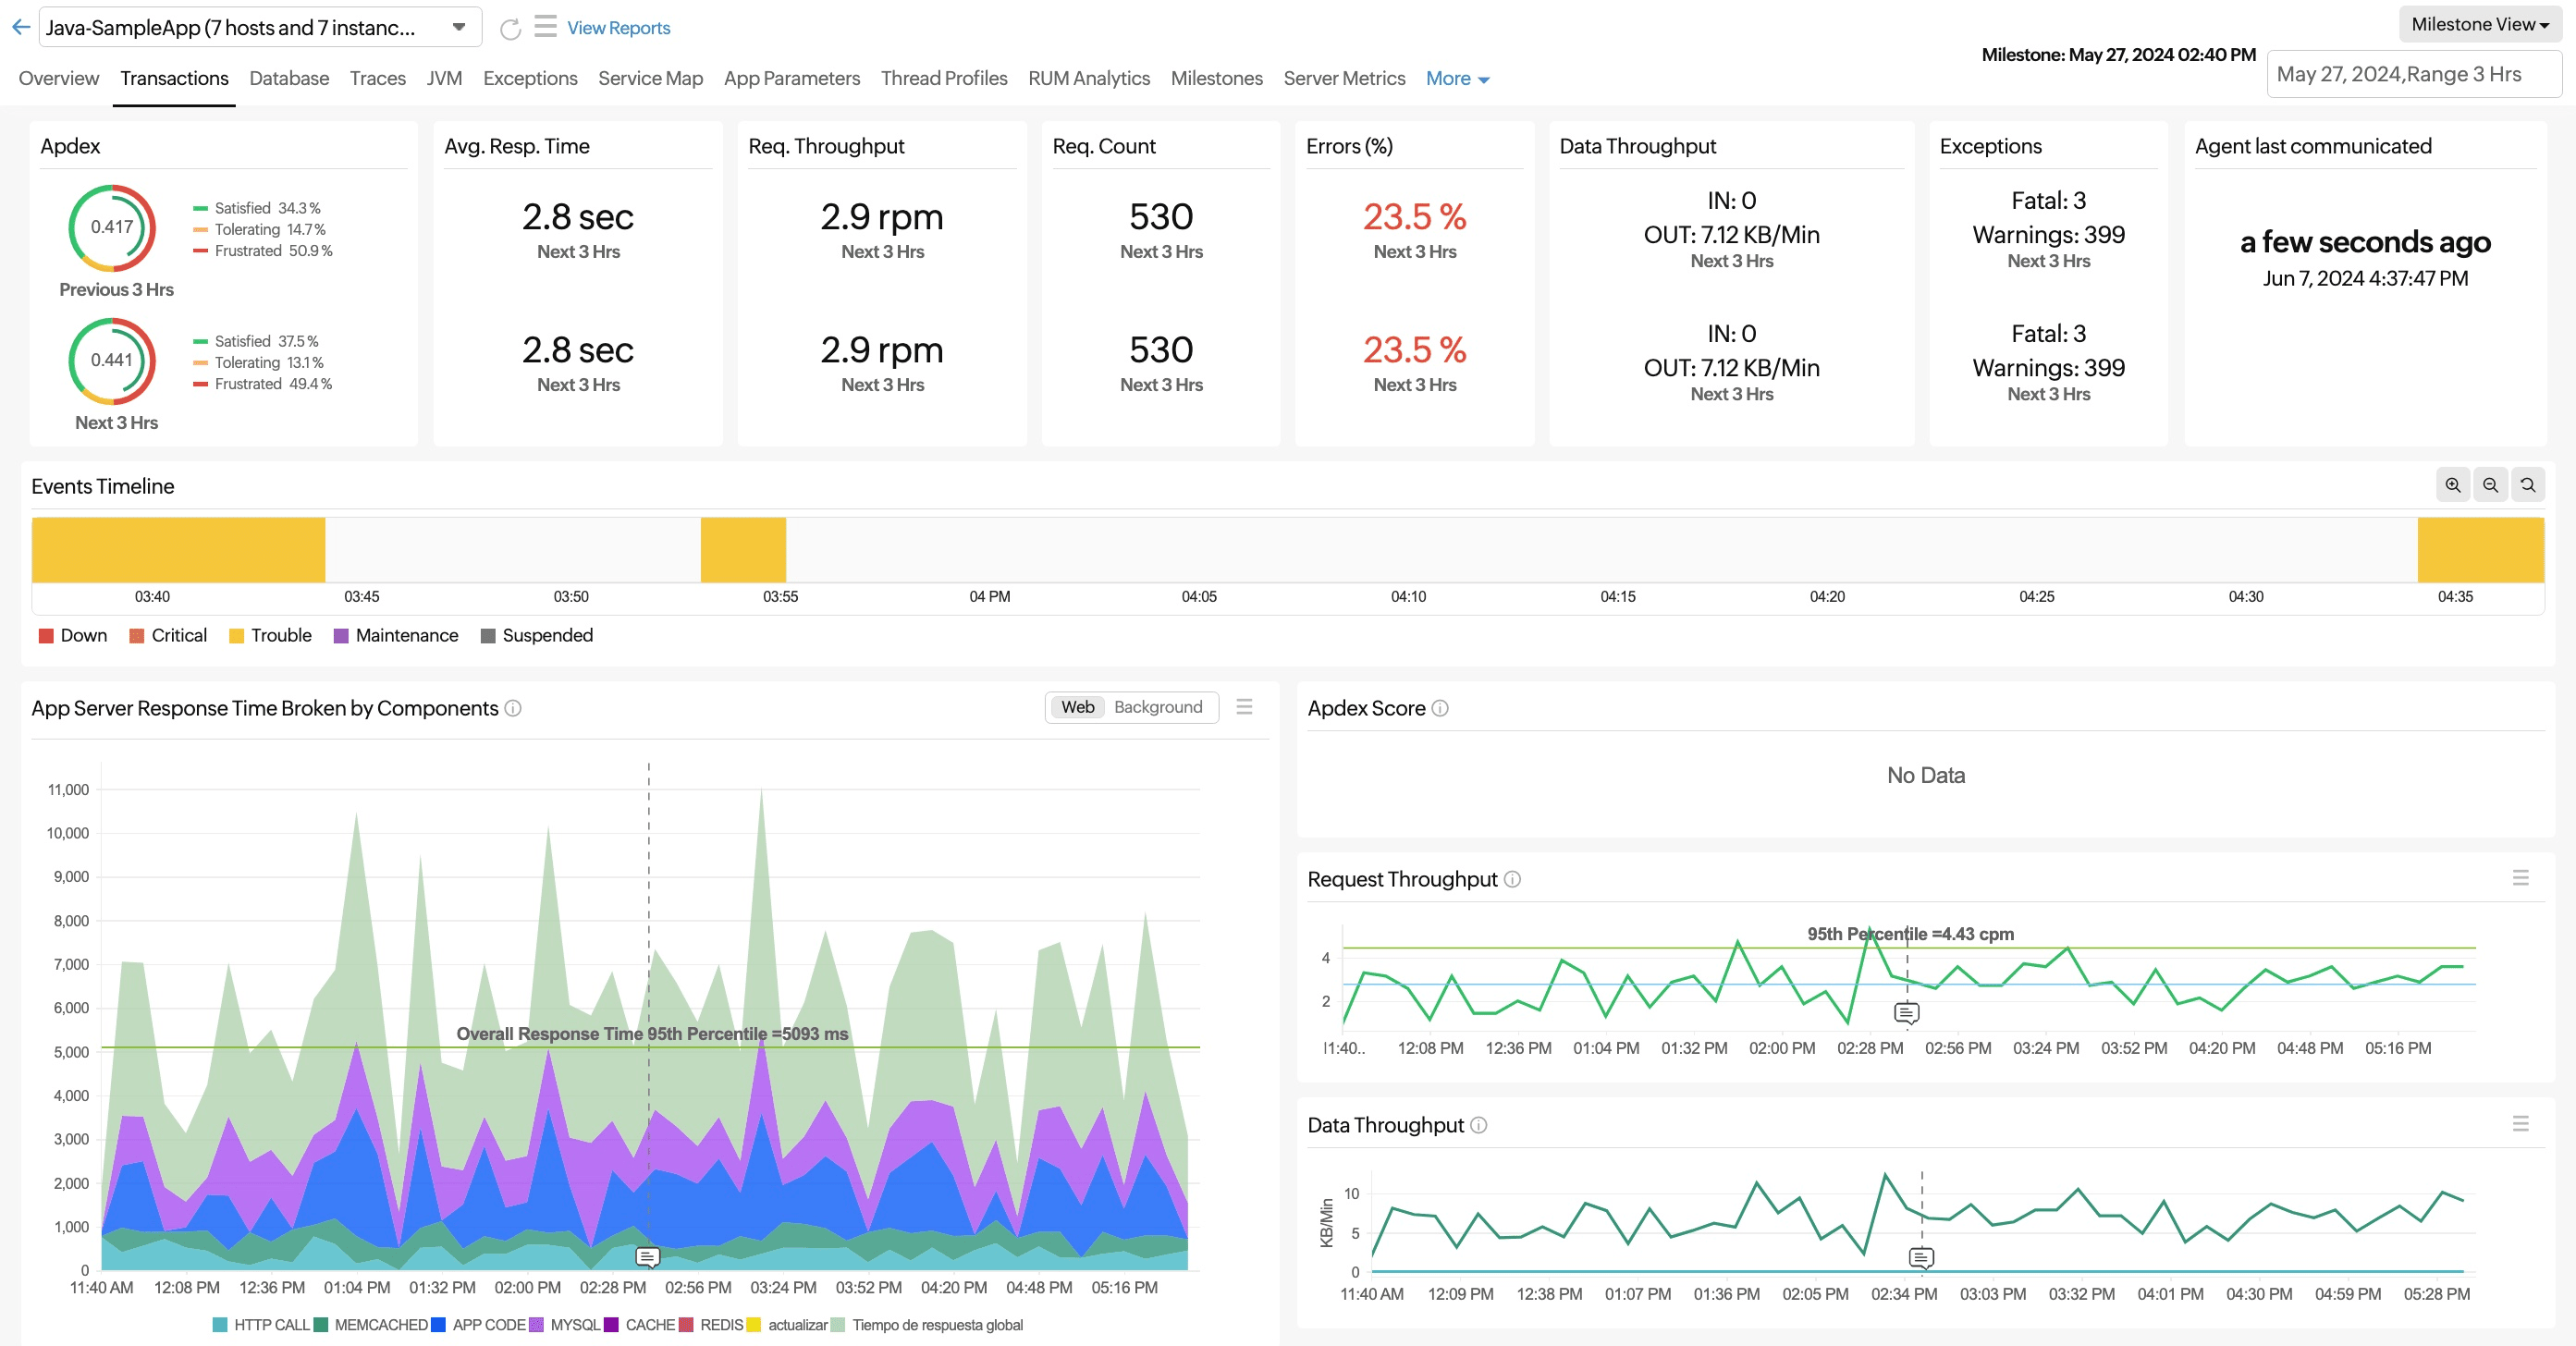
Overview
The basic function of this tab is to give a bird's-eye view of all the major parameters of the application.
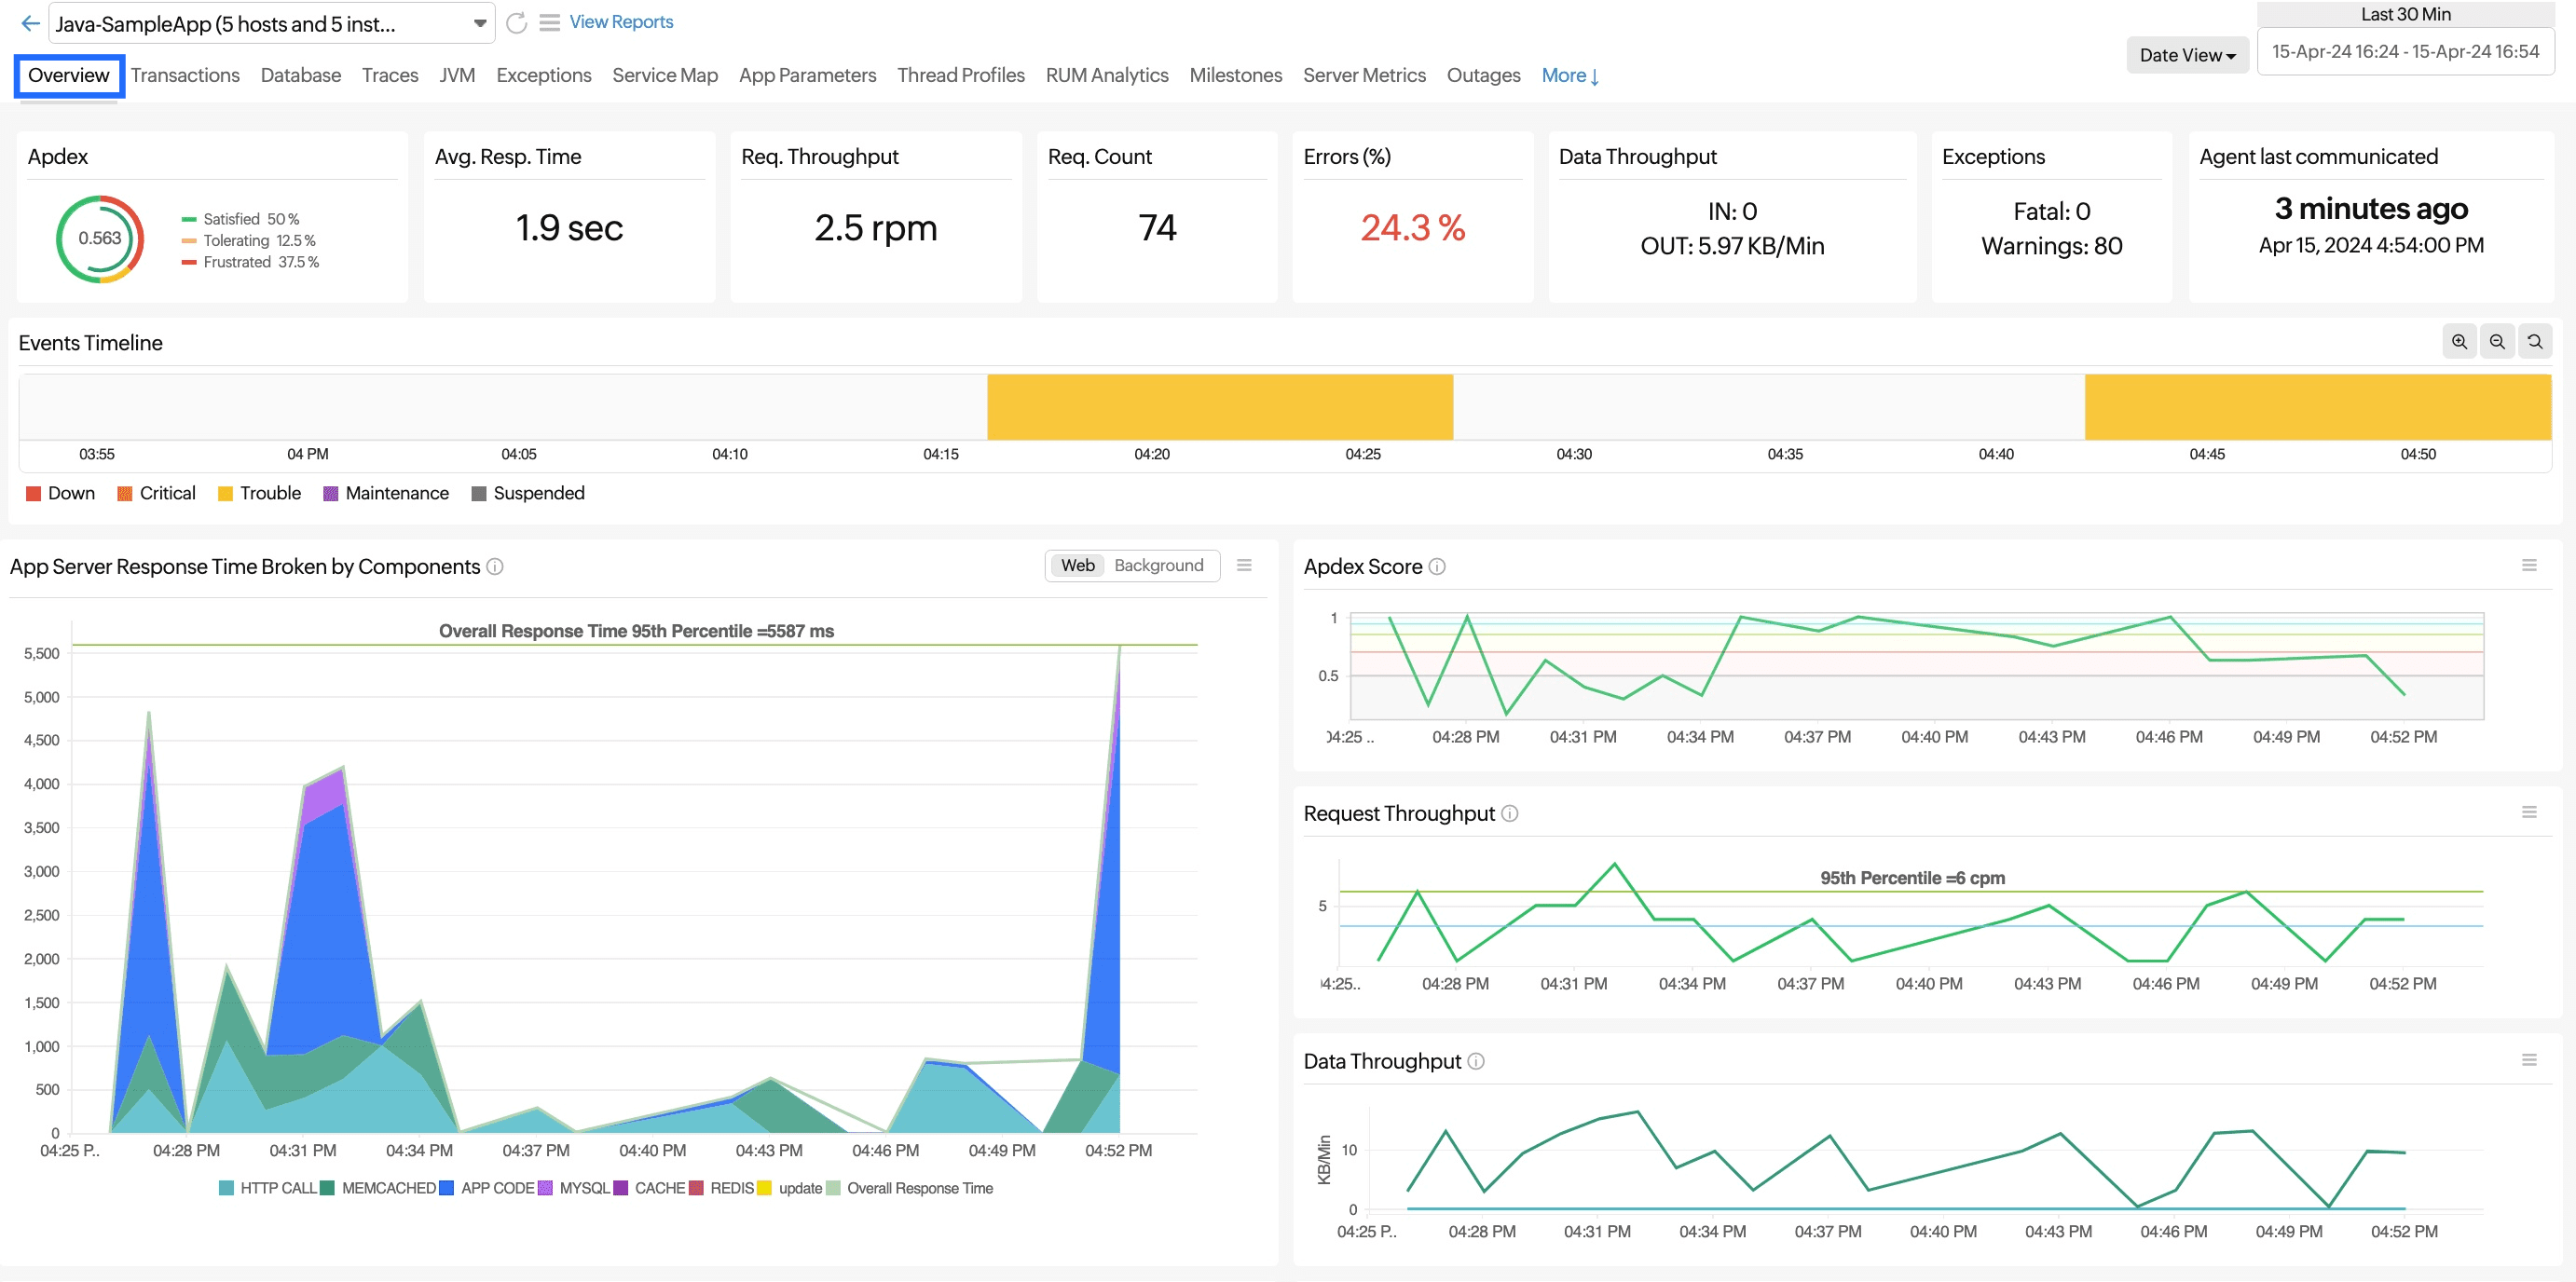
Apdex score:
The Apdex score measures user satisfaction with the application's performance on a scale from one (highest) to 0 (lowest).
If the Apdex score is:
- Above 0.9: Indicates that users are satisfied with the performance.
- Between 0.5 and 0.9: Indicates that users are tolerating the performance.
- Below 0.5: Indicates that users are frustrated with the performance.
Data Throughput:
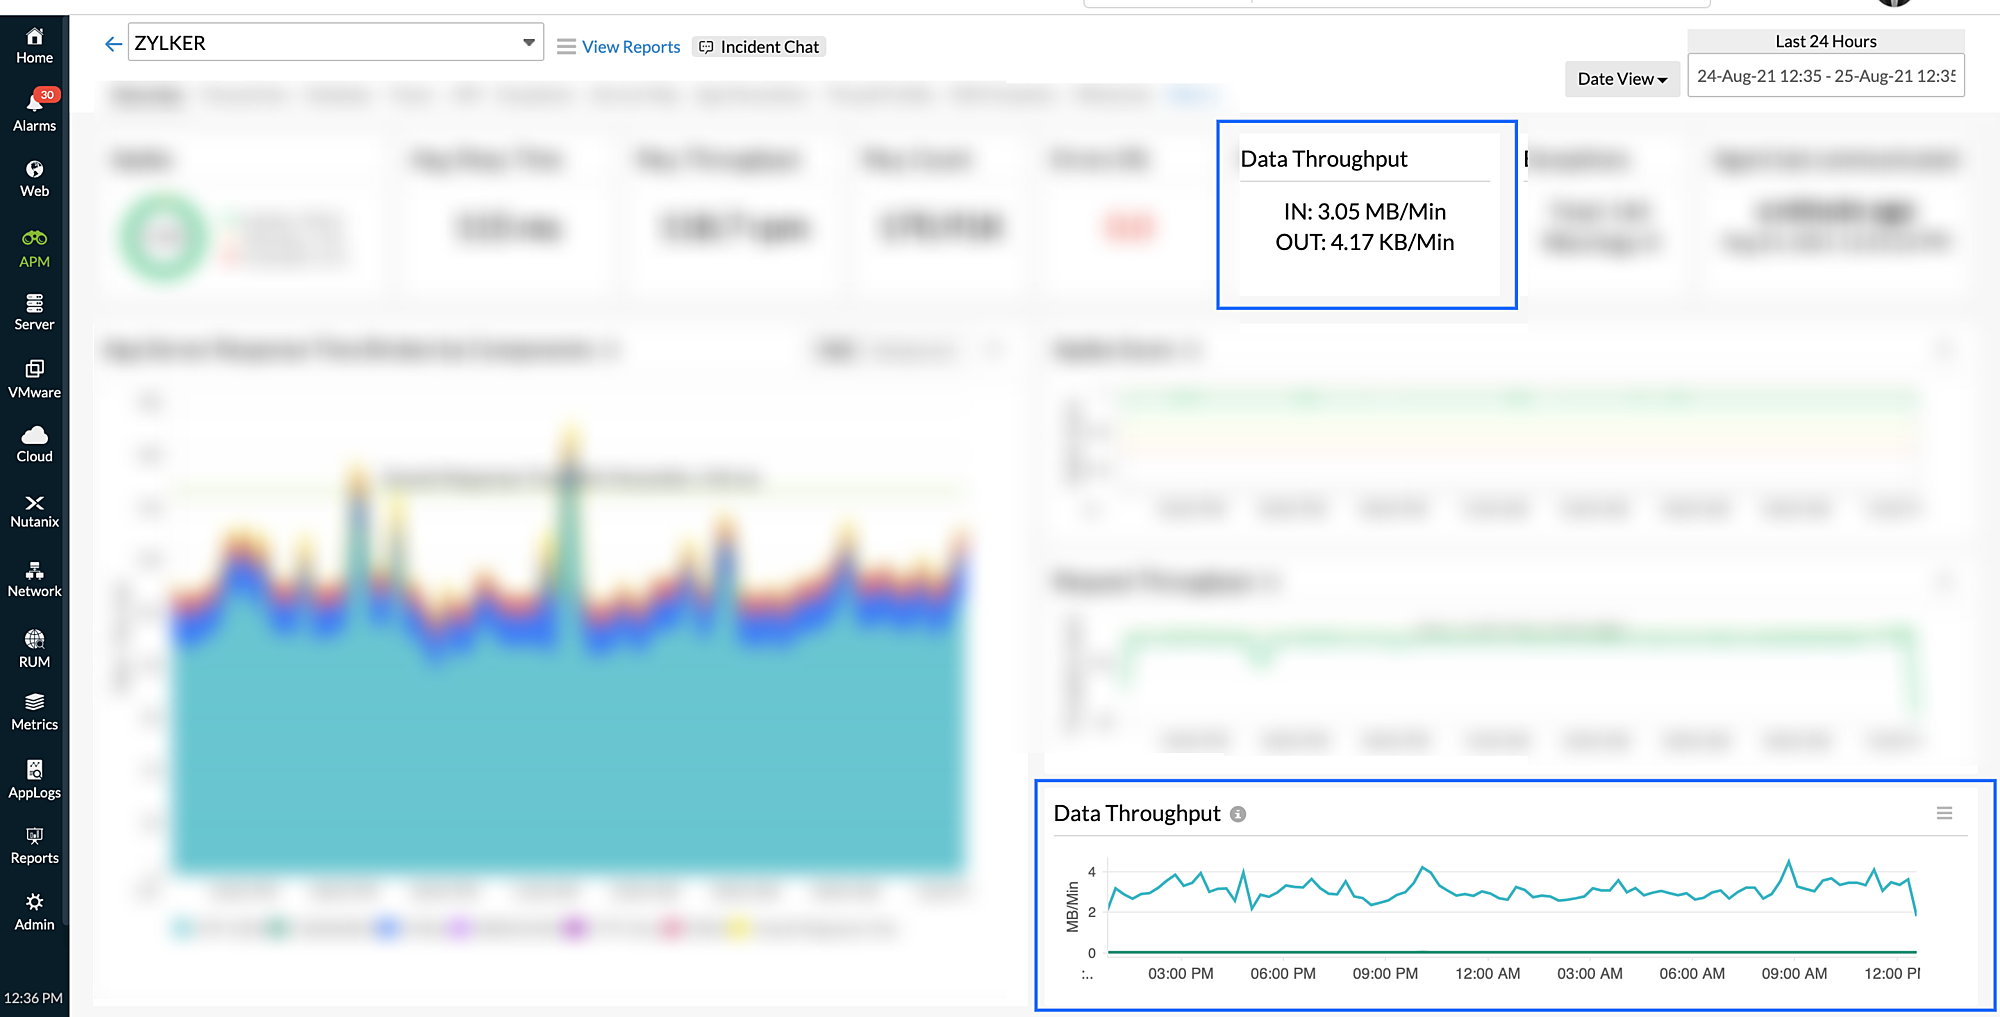
Data throughput helps you assess the size of the incoming request - gives you an idea as how much data your app server is handling.
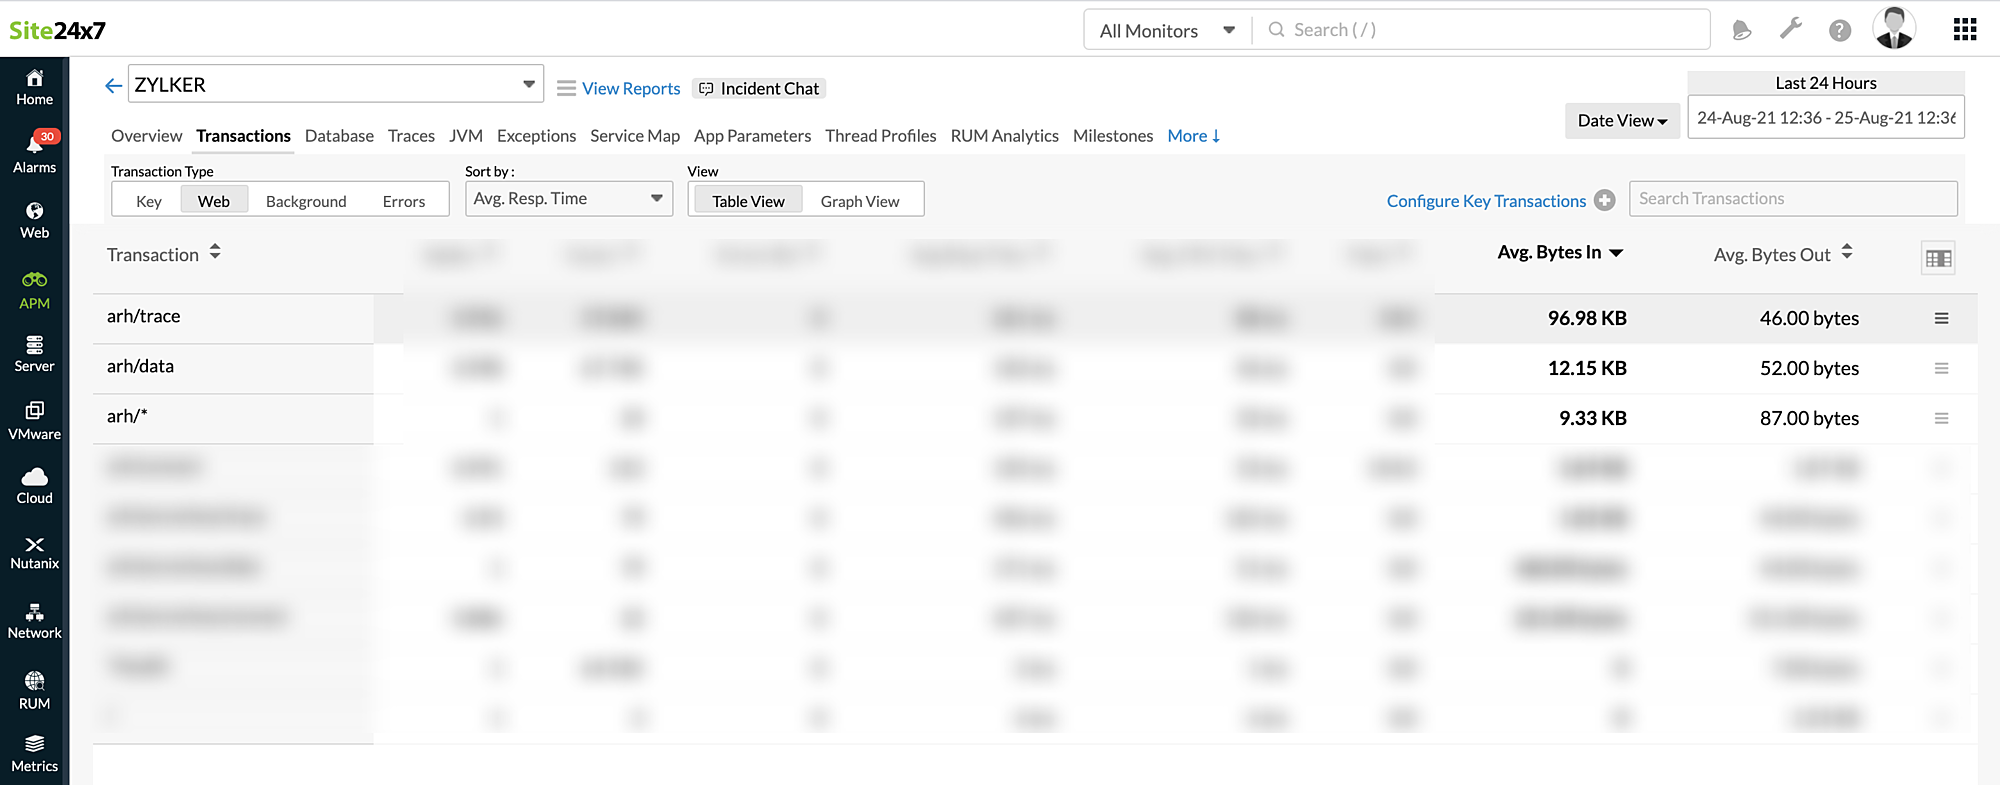
For instance, from the above image, you can understand that the particular transaction arh/trace has a higher request size in comparison with other requests.
This helps you to assess the general size of the incoming requests and this in turn comes handy when there is a sudden spike in the size of the incoming requests.
For example, in the case of DDOS attacks, the incoming requests could be of huge data size, and by knowing your average request sizes, you can easily spot anomalies.
For other metrics, refer to the table below.
| Parameters | Description |
|---|---|
| Apdex | A numerical measure of user satisfaction with the application's performance, with one being the highest and 0 being the lowest. |
| Avg. Resp. Time | The average response time of your application. It refers to the mean duration of all transactions in the application. |
| Req. Throughput | The number of requests received per minute. |
| Req. Count | The total number of requests received during the selected time frame. |
| Errors (%) | The percentage of errors that occurred. |
| Data Throughput | The size of the request and response objects are tracked and shown in data throughput. Request size is captured as Bytes In, and response size is captured as Bytes Out. |
| Exceptions | The total number of fatal exceptions and warnings that occurred. |
| Agent last communicated | Timestamp of the agent's latest communication. |
You can scroll down to see the graphical representation of all the above metrics.
Events Timeline
The Events Timeline widget records all the events of your selected Application/Instance for a selected time range. You can identify/decode various events from the past, which include Down, Critical, Trouble, Maintenance, Anomaly, or Suspended. Each event is color-coded for easy identification. Events can be drilled down to extract maximum data and facilitate easy troubleshooting.
App Server Response Time Broken by Components
Since your application is connected to various components, if the application experiences slowness, it could be due to any of these components being non-functional or taking too long to respond.
If you notice a sudden spike in the graph, you can hover over it to identify which component is causing the delay. The graph is color-coded for clarity and ease of interpretation.
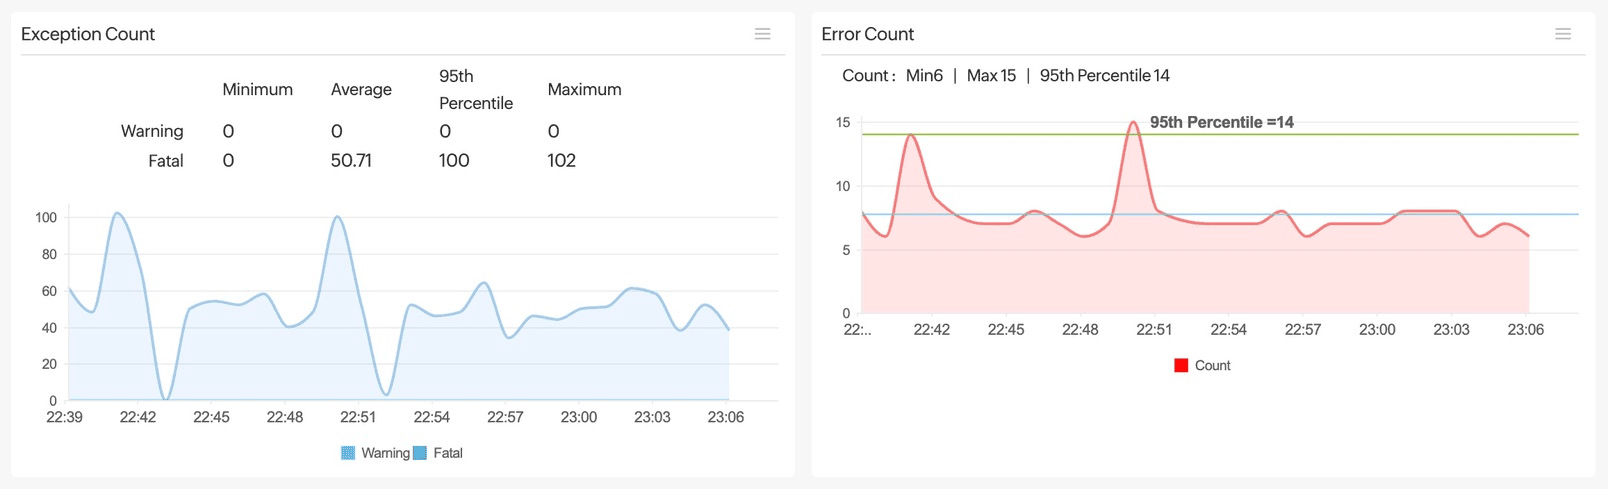
Exception Count
This graph shows the number of exceptions thrown by your application, categorized into Warning and Fatal exceptions. The 95th Percentile value indicates the typical upper bound for exception occurrences. Hover over the graph to view the count at a specific timestamp.
Error Count
This graph displays the total number of application errors recorded during the selected time range.
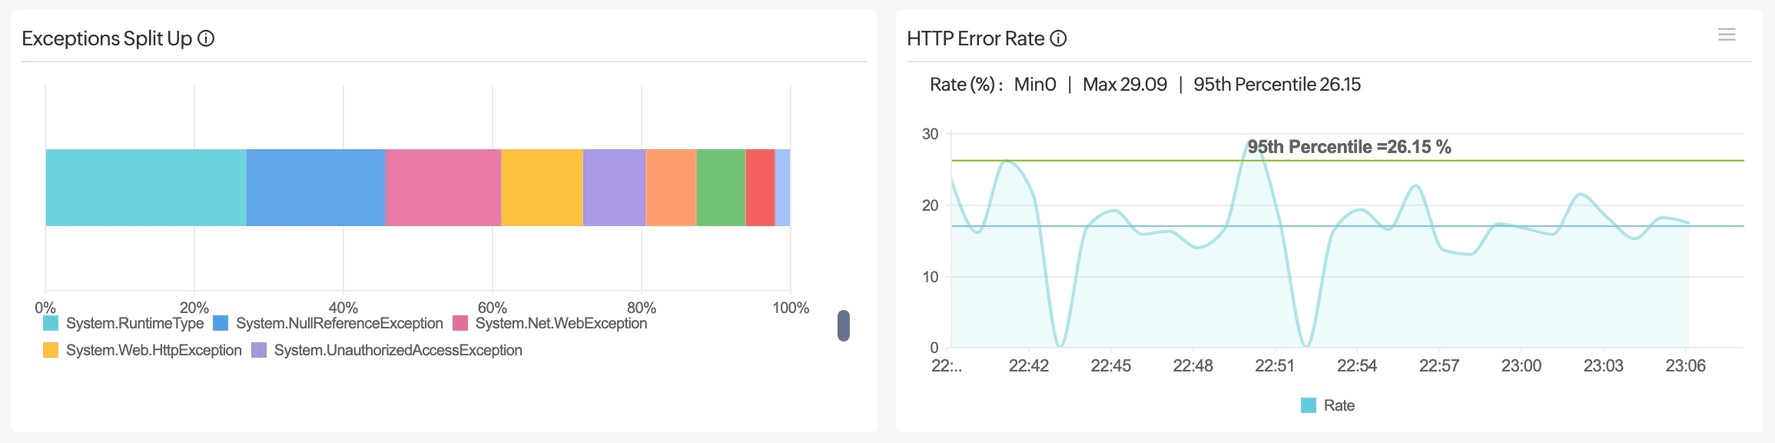
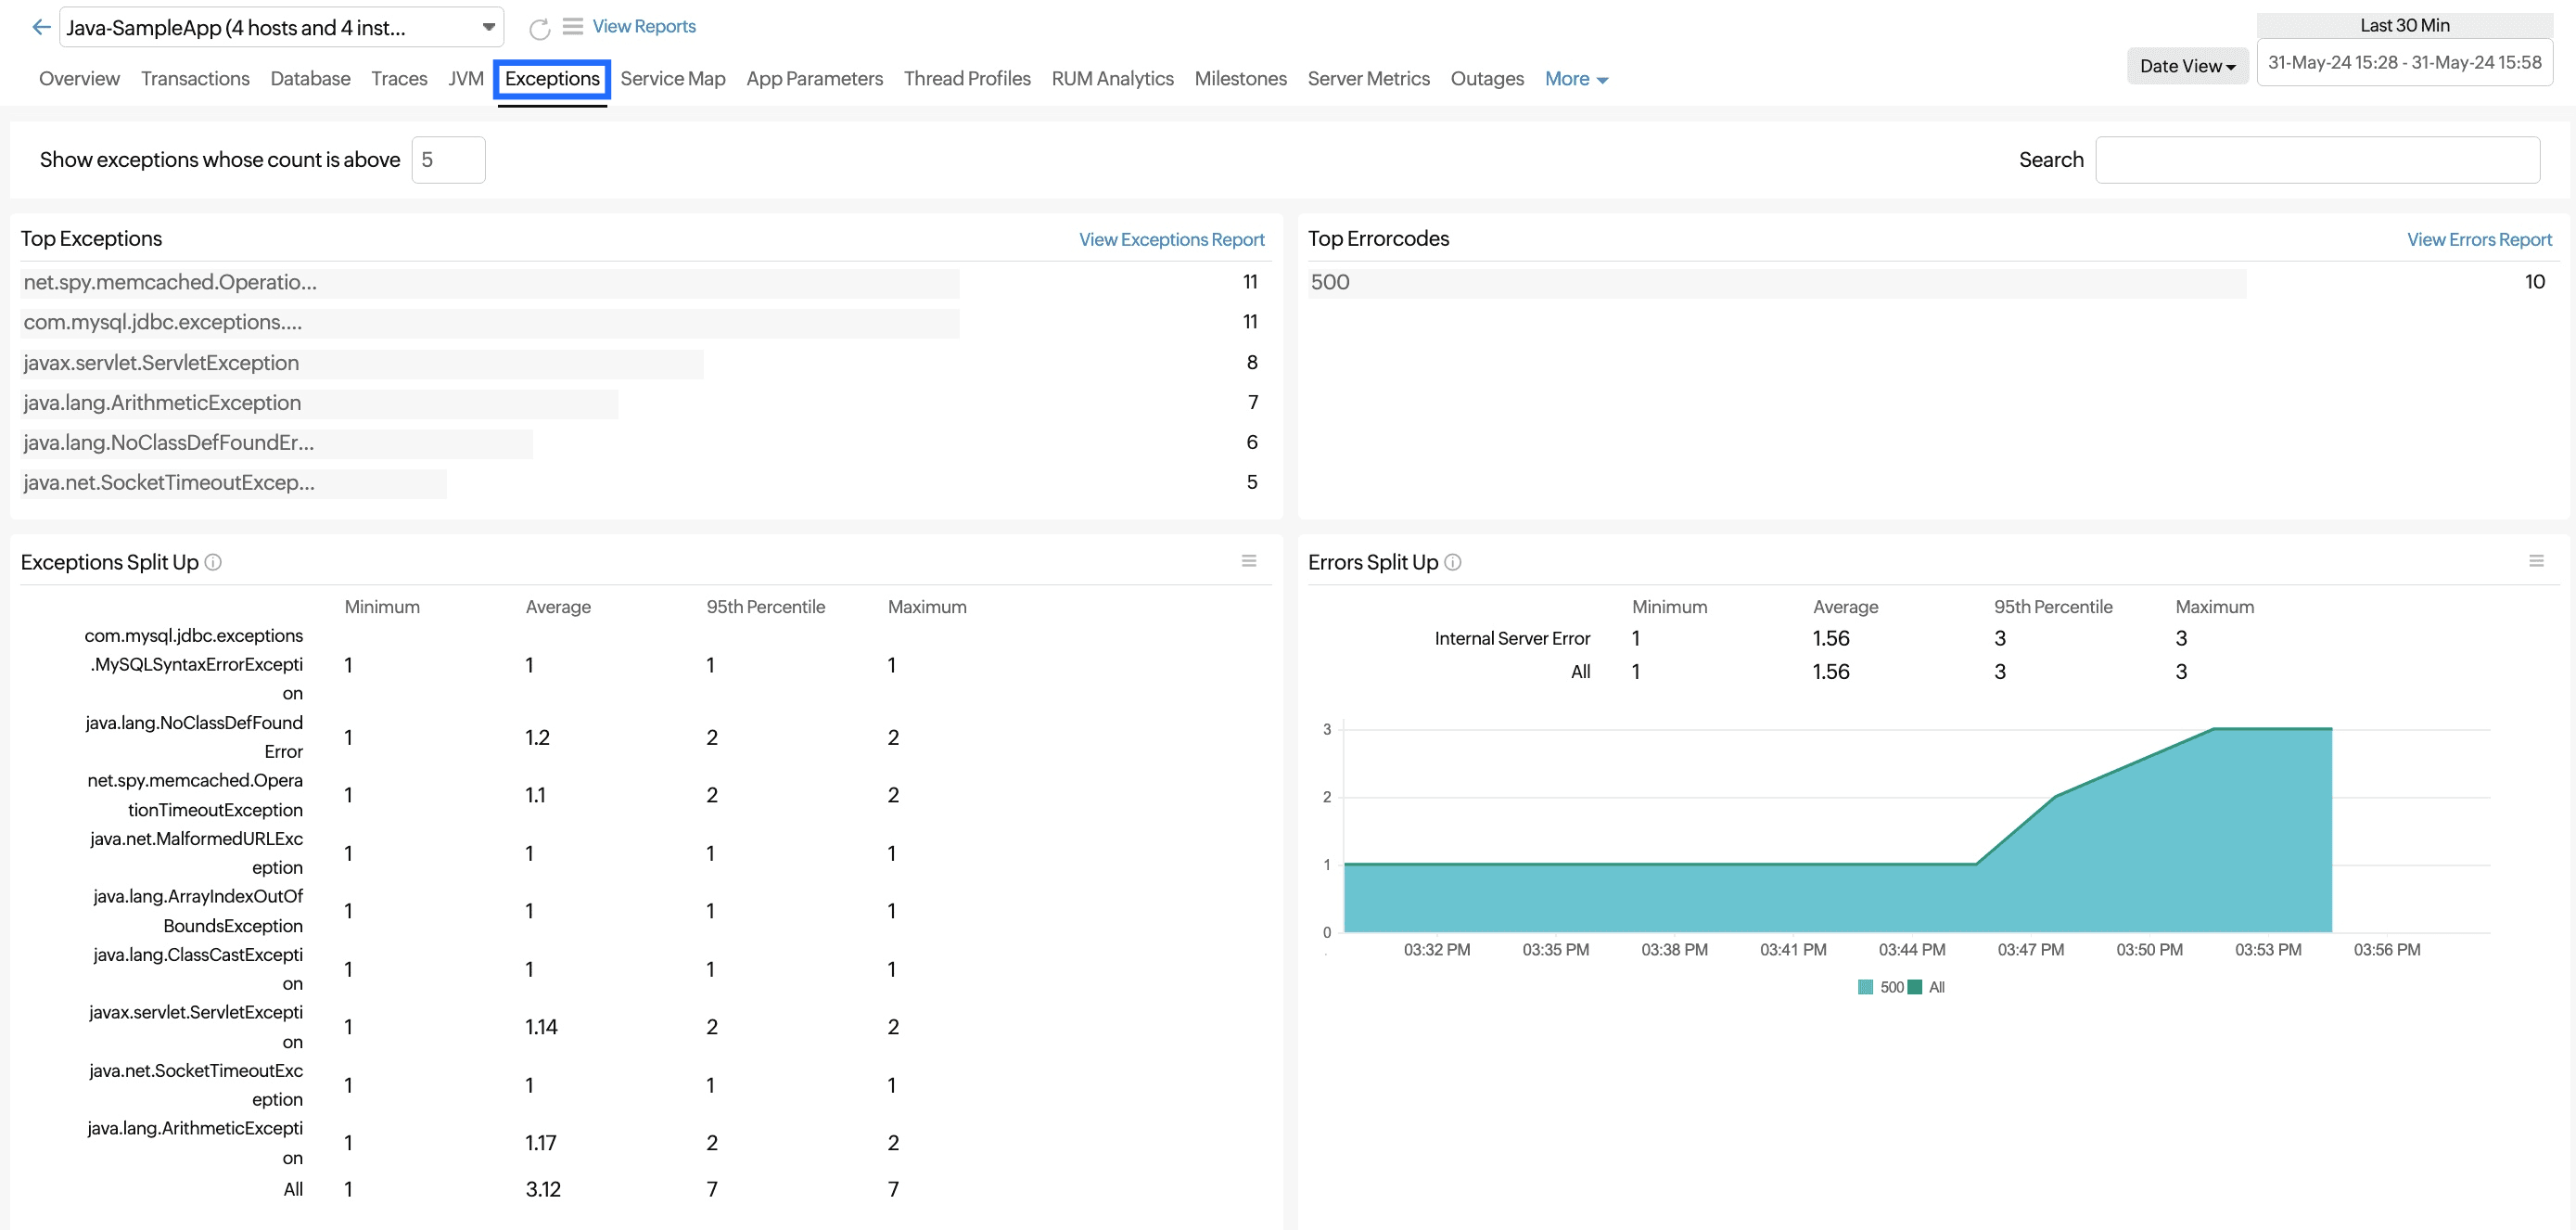
Exceptions Split Up
This graph displays the types of exceptions thrown in your application during the selected time period. Each color in the bar represents a different exception type (e.g., System.RuntimeType, System.Net.WebException, etc.).
HTTP Error Rate
This graph shows the percentage of HTTP errors in your application over time.
- The line graph helps you visualize fluctuations in the HTTP error rate.
- Summary metrics such as Min, Max, and 95th Percentile values help you understand the severity and spread of the error rates.
RUM-related metrics
You can view the data in these graphs only if your application is linked with a RUM monitor.
If you want to associate a RUM monitor with your APM monitor:
- Click the hamburger icon () located near the Applications/Instances drop-down.
- Select Enable Web RUM.
- Choose the appropriate RUM application.
- Click Save.
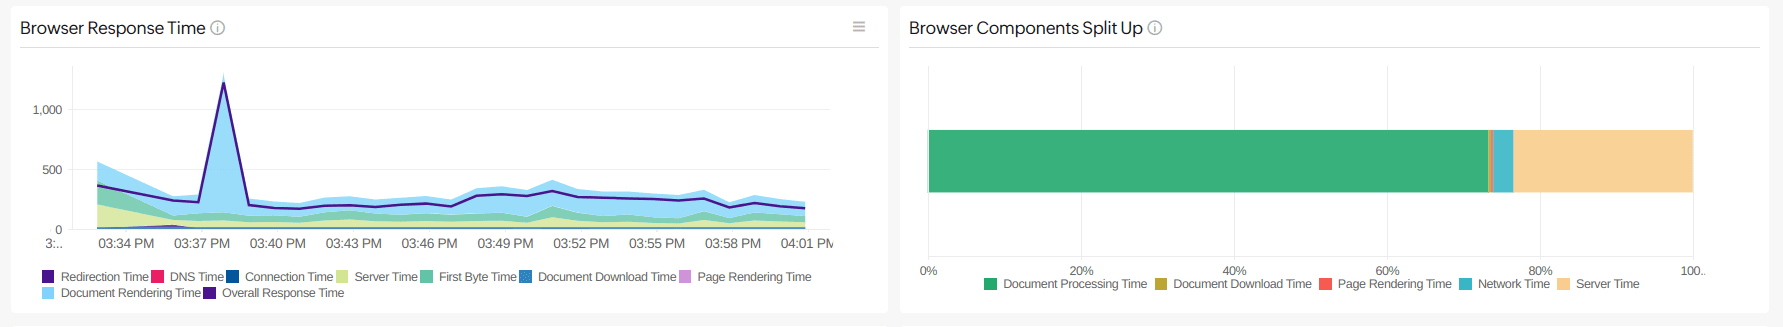
Browser Response Time
This graph in provides a breakdown of various components that contribute to the overall response time of a web application. This breakdown typically includes Redirection Time, DNS Time, Connection Time, Server Time, First Byte Time, Document Download Time, Page Rendering Time, and Document Rendering Time.
Browser Components Split Up
This widget displays the breakdown of different components that contribute to the overall response time of a web application, which includes Redirection Time, DNS Time, Connection Time, Server Time, First Byte Time, Document Download Time, Page Rendering Time, and Document Rendering Time.
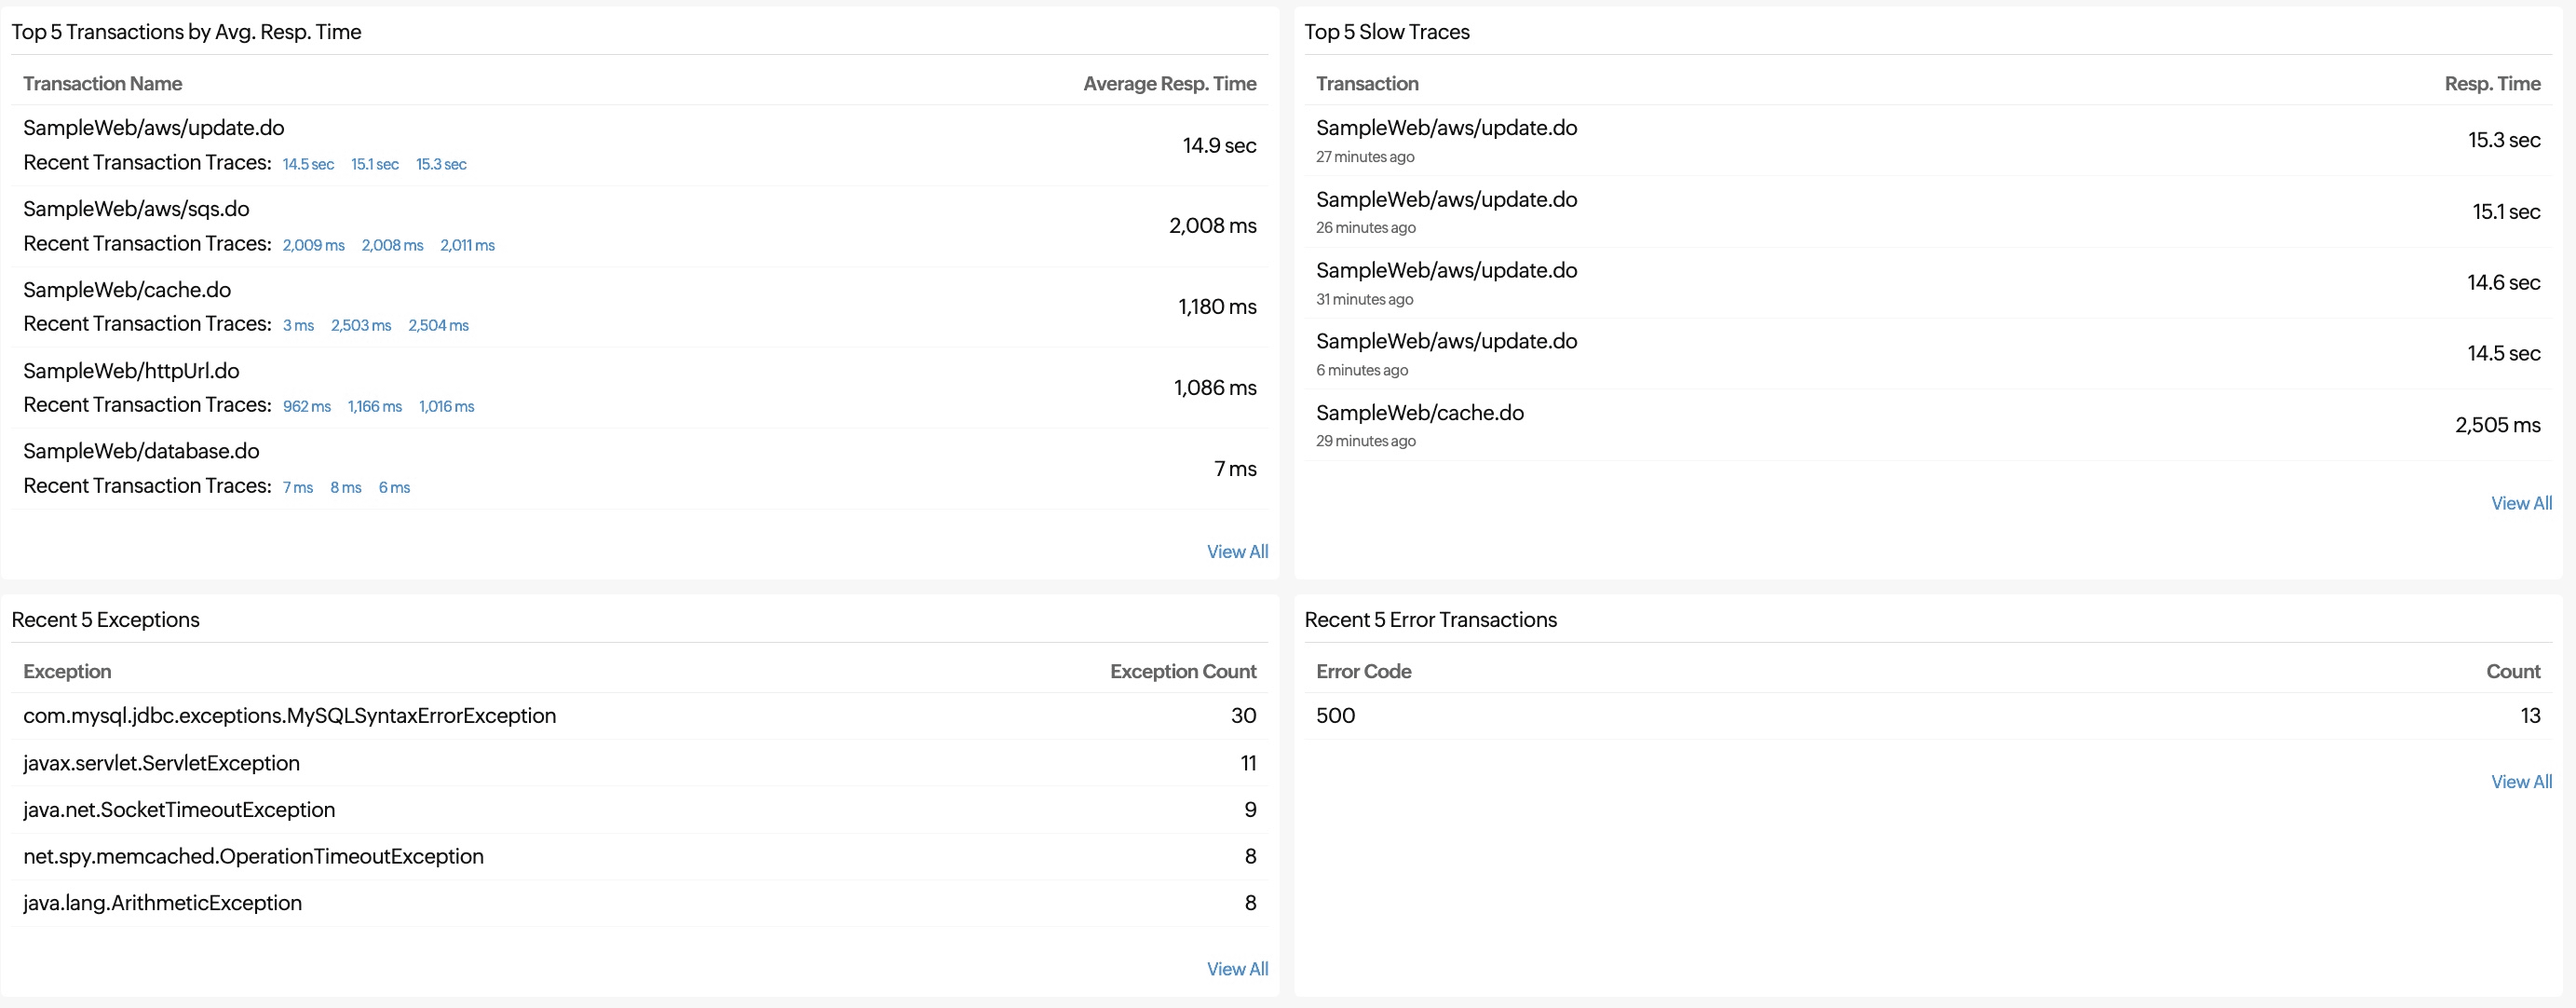
Top five traces and transactions
If you further scroll down, you can get the list of the top five transactions by the average response time, top five slow traces, recent five exceptions, and recent five error transactions.
Recent events of an application
It shows all the events of your selected Application/Instance for a selected time range.
Instance Count
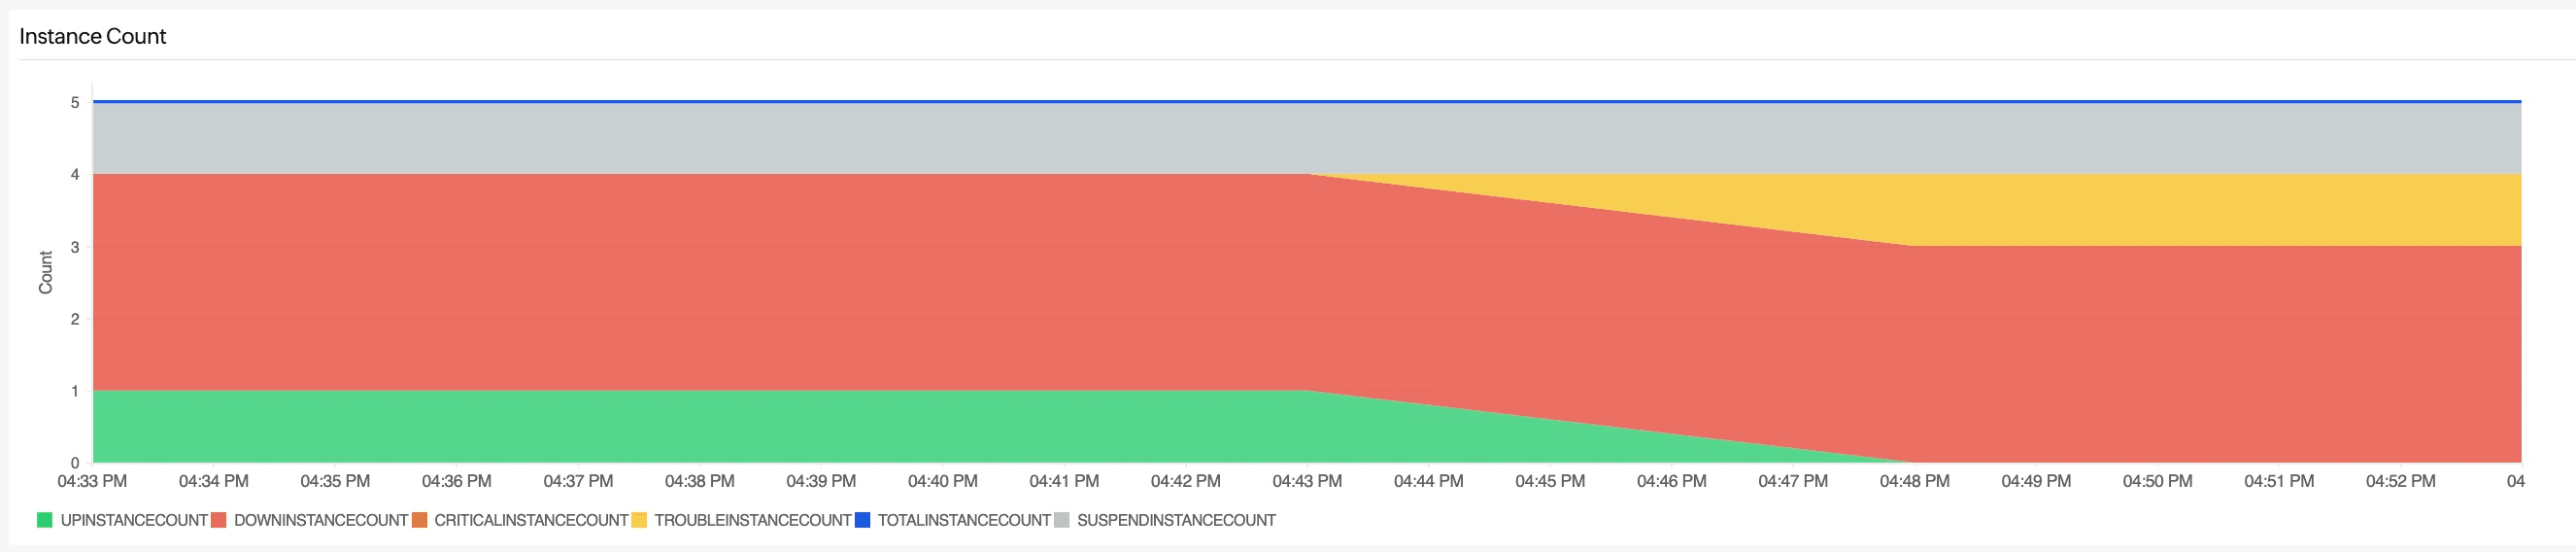
You can hover over the required time to see the breakdown of instances in different statuses like UP, DOWN, CRITICAL, TROUBLE, and SUSPEND.
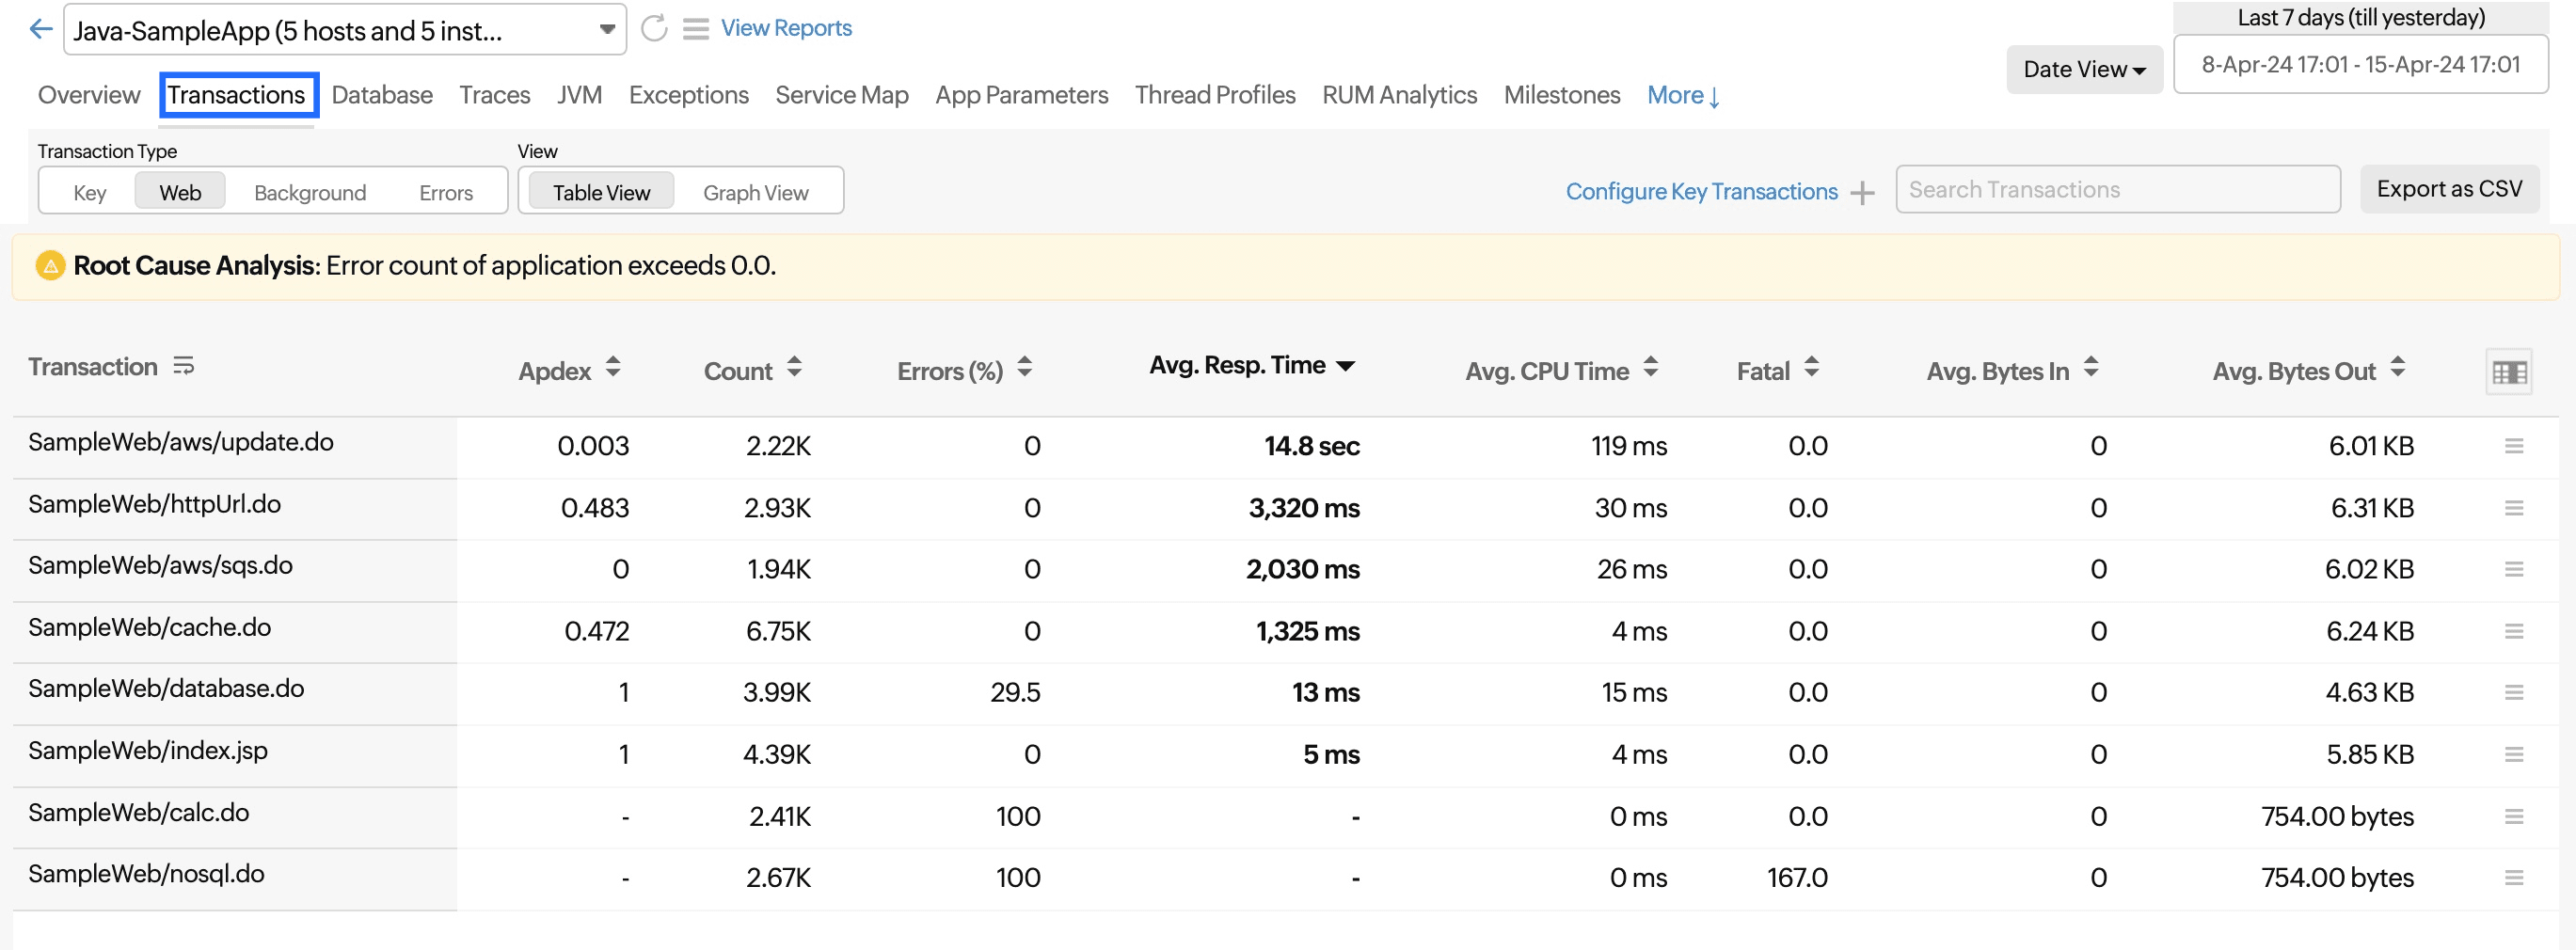
Transactions
You can see the list of all transactions in the application.
| Parameters | Description |
|---|---|
| Transaction | Name of the transaction. |
| Apdex | A numerical measure of user satisfaction with the application's performance, with one being the highest and 0 being the lowest. |
| Count | The number of times a particular transaction has been called by a user. |
| Errors (%) | The percentage of errors that has occurred in a particular transaction. |
| Error Count | The total number of errors that occurred in a particular transaction. |
| Avg. Resp. Time | The average amount of time a particular transaction takes to respond to a user request. |
| Min Resp Time | The minimum response time of the transaction. |
| Max Resp Time | The maximum response time of the transaction. |
| Total Resp Time | The total response time of the transaction. |
| Avg. CPU Time | The average amount of time taken by the CPU to respond. |
| Fatal | The number of fatal errors that occur in a particular transaction. |
| Avg. Bytes In | The average number of requests received, with request size measured in Bytes In. |
| Min Bytes In | The minimum amount of data received during a transaction, measured in bytes. |
| Max Bytes In | The maximum amount of data received during a transaction, measured in bytes. |
| Total Bytes In | The total number of responses received, with response size measured in Bytes In. |
| Avg. Bytes Out | The average number of responses sent, with response size measured in Bytes Out. |
| Min Bytes Out | The minimum amount of data transmitted during a transaction, measured in bytes. |
| Max Bytes Out | The maximum amount of data transmitted during a transaction, measured in bytes. |
| Total Bytes Out | The total number of responses sent, with response size measured in Bytes Out. |
- Click Export as CSV to export the transactions report.
- Click Configure Key Transactions to add the required transactions as key transactions.
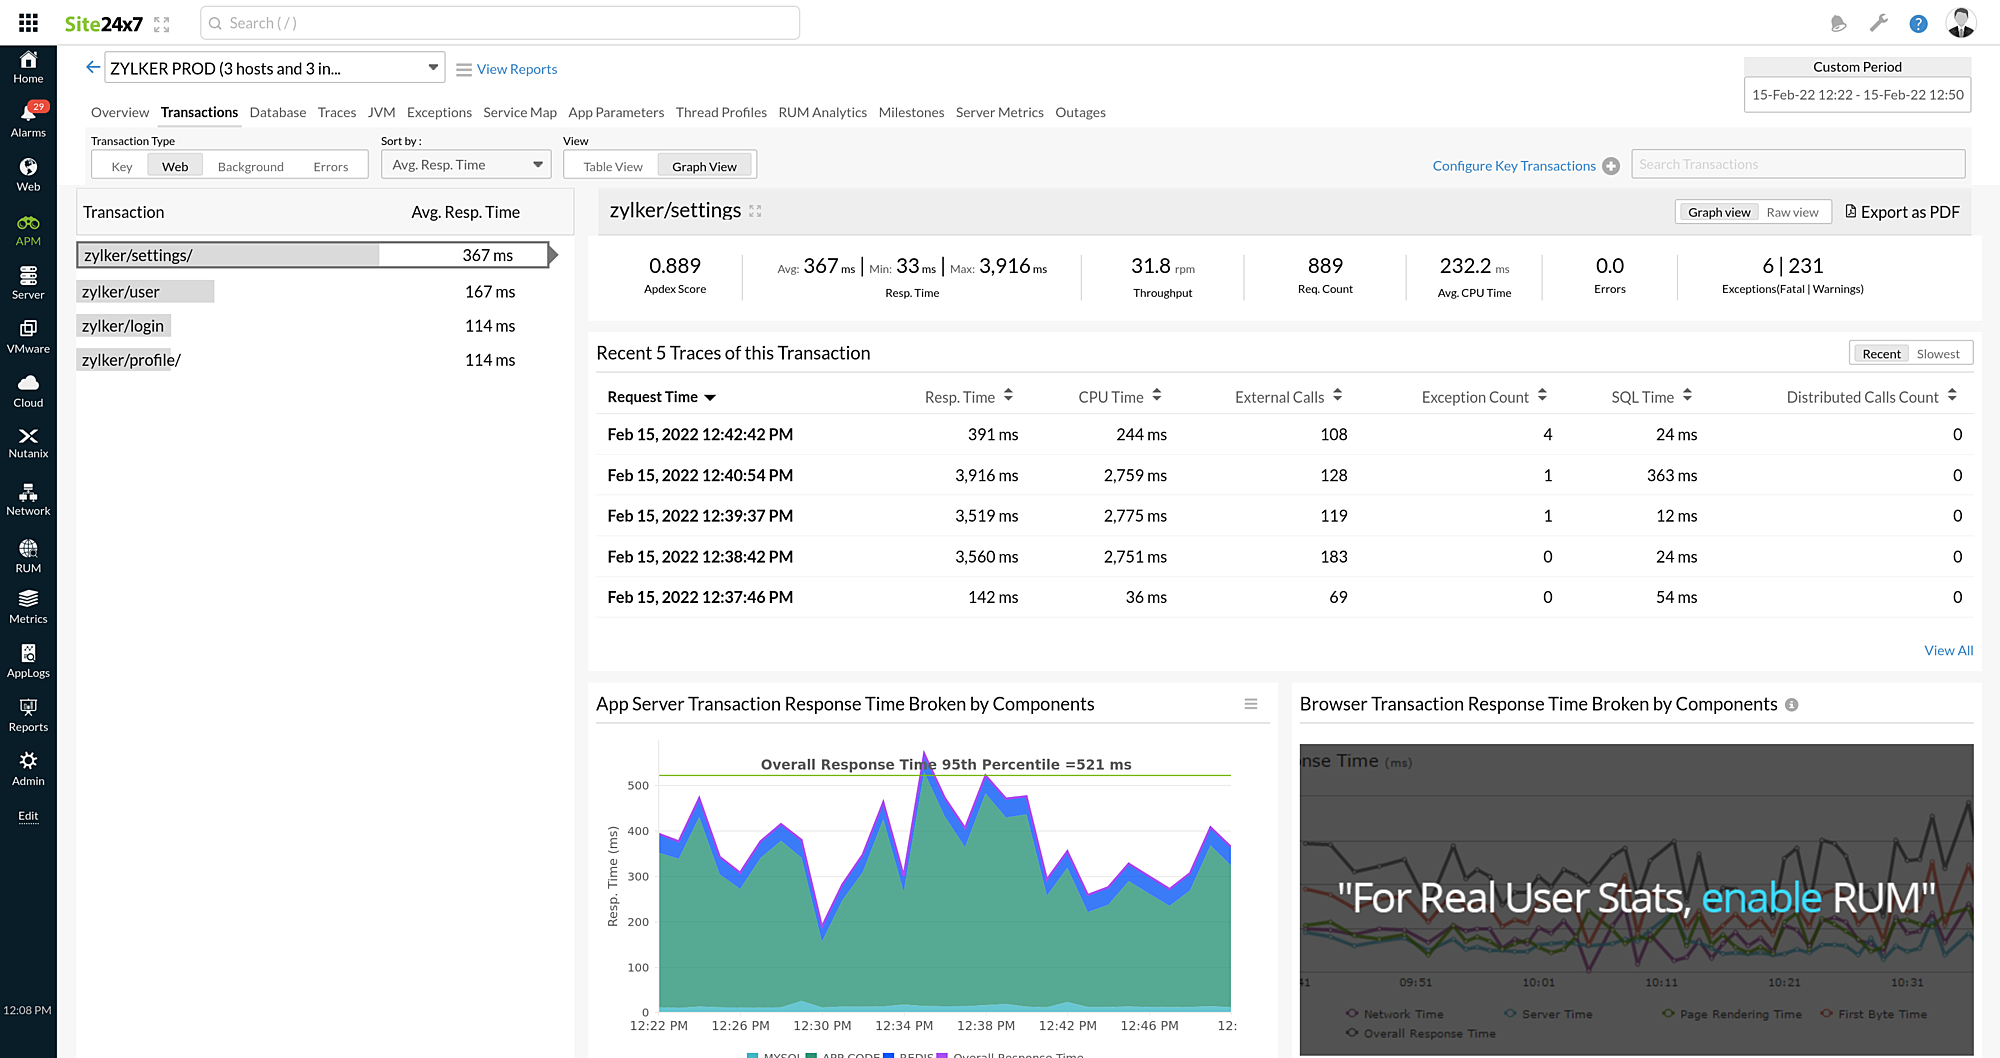
Transaction Type
The transactions are categorized and displayed under four different tabs.
- Key
This tab displays the list of key transactions. - Web
This tab displays the list of all web transactions in the application. - Background
This tab displays the list of background transactions. - Errors
This tab displays the transactions with errors.
Views
You can view the metrics in two different views, Table View and Graph View. By default, the metrics are shown in Table View.
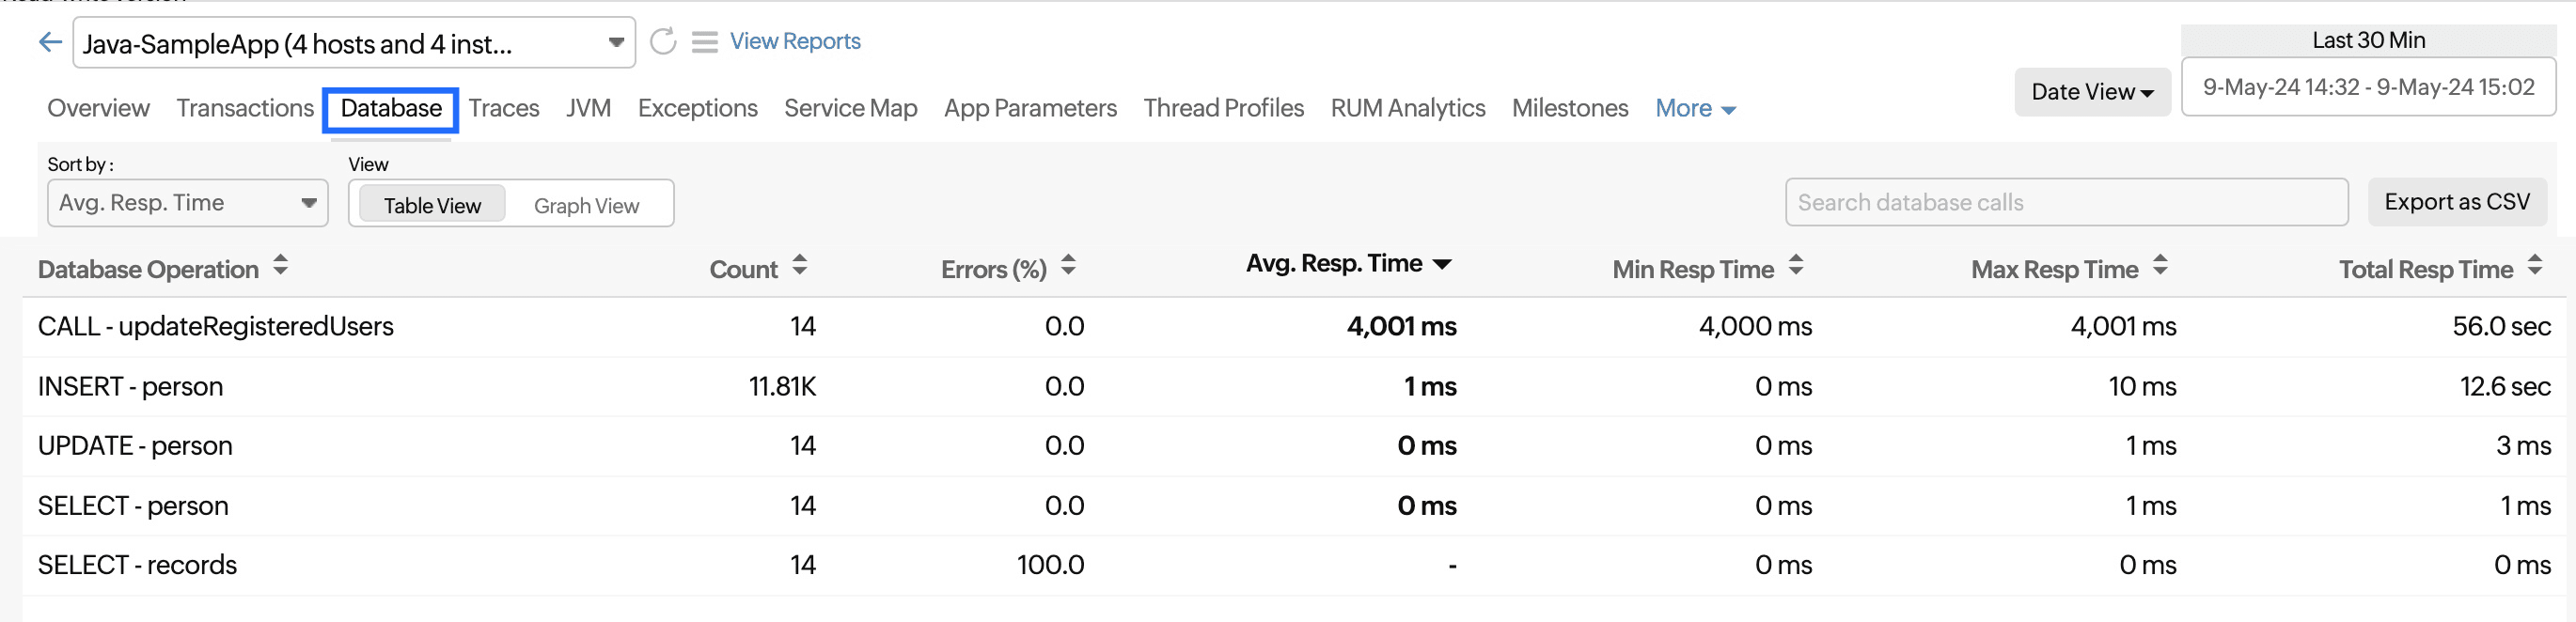
Database
This section provides a complete description of the total number of SQL queries that are executed for the application.
| Parameters | Description |
|---|---|
| Database Operation | The name of the DB operation performed. |
| Count | The number of times a particular DB operation has been executed in the application, in a chosen timeframe. |
| Errors (%) | The percentage of errors that have occurred in a particular DB operation. |
| Avg. Resp. Time | The average amount of time a particular DB operation takes to complete. |
| Min Resp Time | The lowest amount of time a DB operation takes to complete. |
| Max Resp Time | The highest amount of time a DB operation takes to complete. |
| Total Resp Time | The total response time of a DB operation. |
Views
You can view the metrics in two different views: Table View and Graph View. By default, the metrics are shown in Table View.
Sort
You can use the Sort by option to arrange the records based on the values: Avg. Resp. Time, Count, Errors (%), and Total Resp. Time.
Search
You can also search for a DB operation directly using the Search database calls box as shown.
Export data
You can also export the DB report using the Export as CSV option.
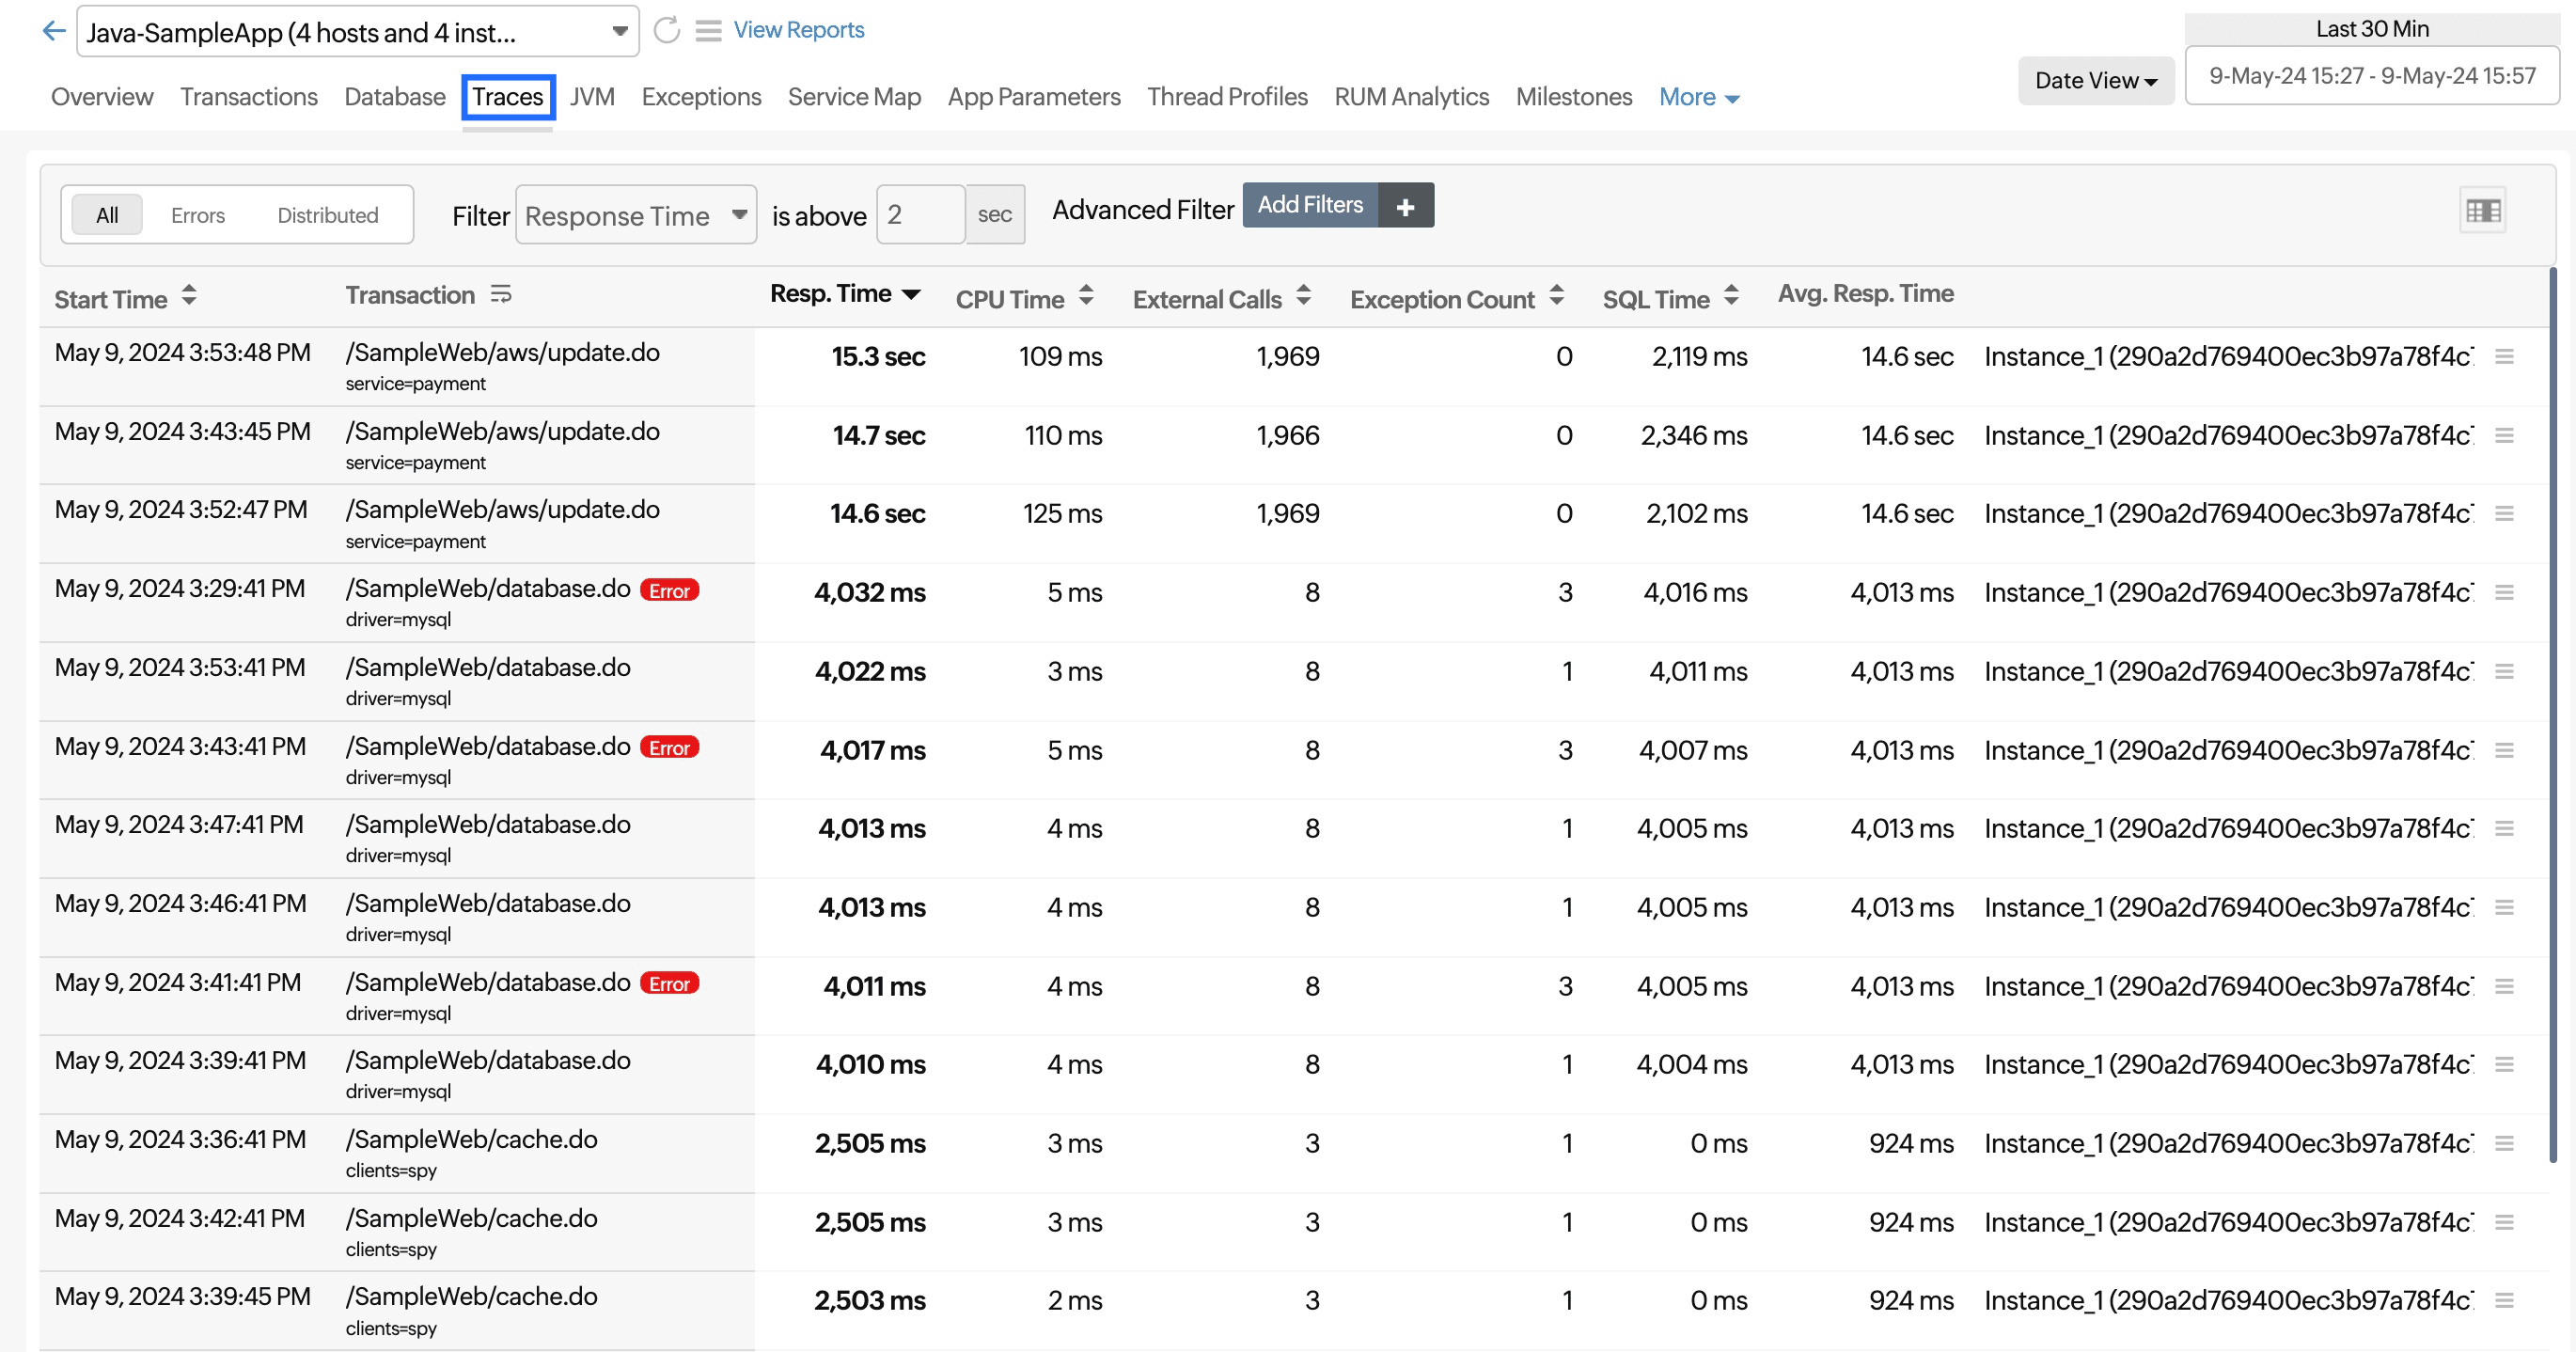
Traces
What is a trace?
When a transaction exceeds the specified threshold value, it is captured as a trace.
This section provides a list of all the traces that have been captured for this application.
| Parameters | Description |
|---|---|
| Transaction | The name of the transaction on which the trace was captured. |
| Resp. Time | The time taken by the transaction to complete its execution. |
| CPU Time | The time spent on the CPU for processing the transaction. |
| External Calls | The number of external remote calls made during the execution. |
| Exception Count | The total number of exceptions that occurred. |
| SQL Time | The time taken by the SQL queries to complete. |
| Avg. Resp. Time | The average amount of time a particular trace takes to respond to a user request. |
| Total Bytes In | The amount of data brought in by the request. |
| Total Bytes Out | The amount of data sent as response to the request. |
| Memory Used | The amount of memory used by the transaction. |
| Distributed Calls Count | The number of times a particular trace has made calls to other distributed applications. |
| Instance | The mapped instance. |
Trace Type
The traces are categorized and displayed under three different tabs.
| All | This tab displays a list of all traces. |
| Errors | This tab displays the list of traces containing errors. |
| Distributed | This tab displays the list of distributed traces. |
Filter and advanced filter
Site24x7 uses Filter and Advanced Filter options to identify traces based on multiple search conditions. You can then perform the required action on the filtered traces. You can apply the filters to any of these three categories:
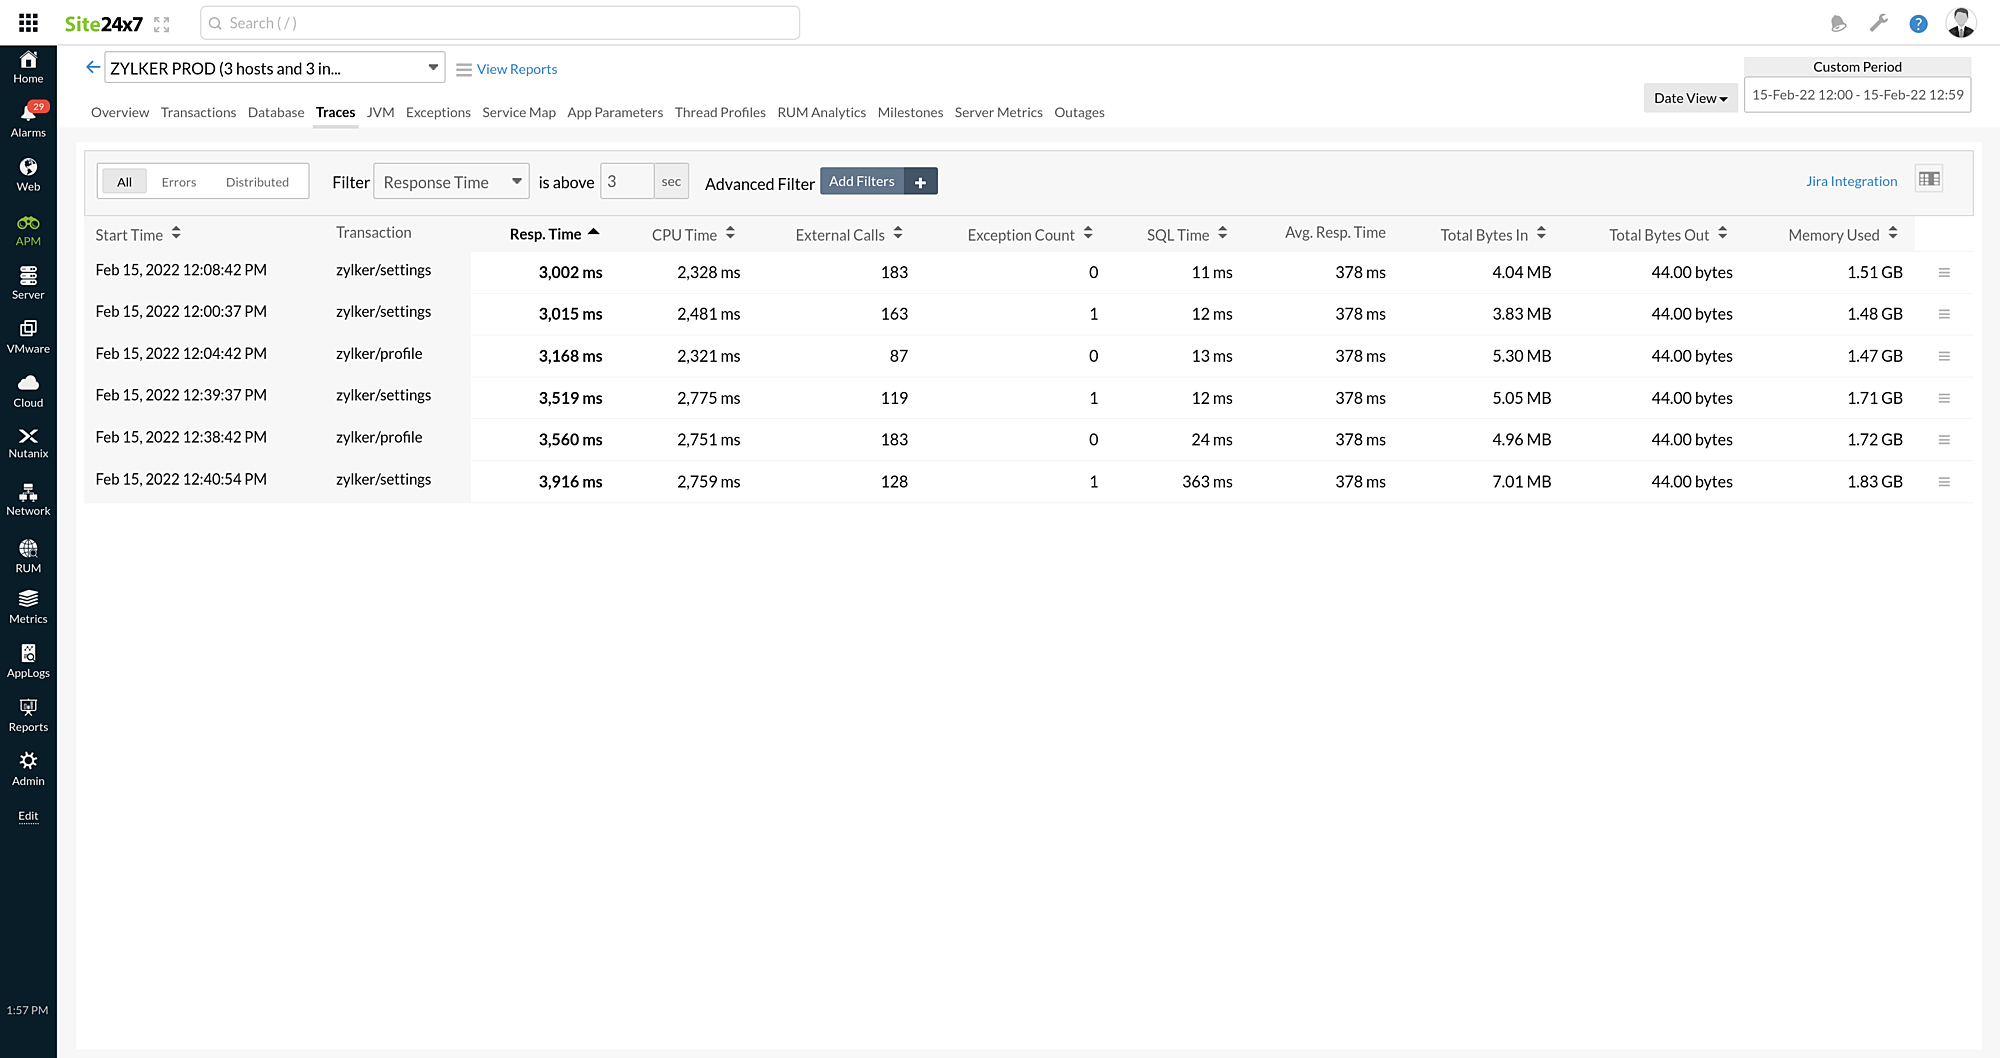
Filter:
You can perform a quick search based on any of the trace metrics by selecting it from the Filter drop-down and specifying the threshold value in the provided is above box.
Example: If you choose Response Time from the Filter drop-down and set the threshold value as three seconds in theis above box, all traces with response times greater than three seconds will be displayed.
Advanced Filter:
The Advanced Filter option has built-in AND conditions, allowing you to specify an unlimited number of search conditions. During the filtration process, the AND conditions will be implemented, meaning only traces concurring to all of these conditions will be displayed.
You can click the Add Filters option to select the required field type—be it Transaction Name, Exception Class, Component Name, or another filter—and the field value. The field values will be listed based on the field type selected.
You can add multiple filters one by one. Each filter added will be considered as an AND condition.
For example, in the image below, the search criteria has three conditions—Transaction Name as zylker/settings/, Exception as java.lang.NullPointerException, and Response Time as above twoseconds.
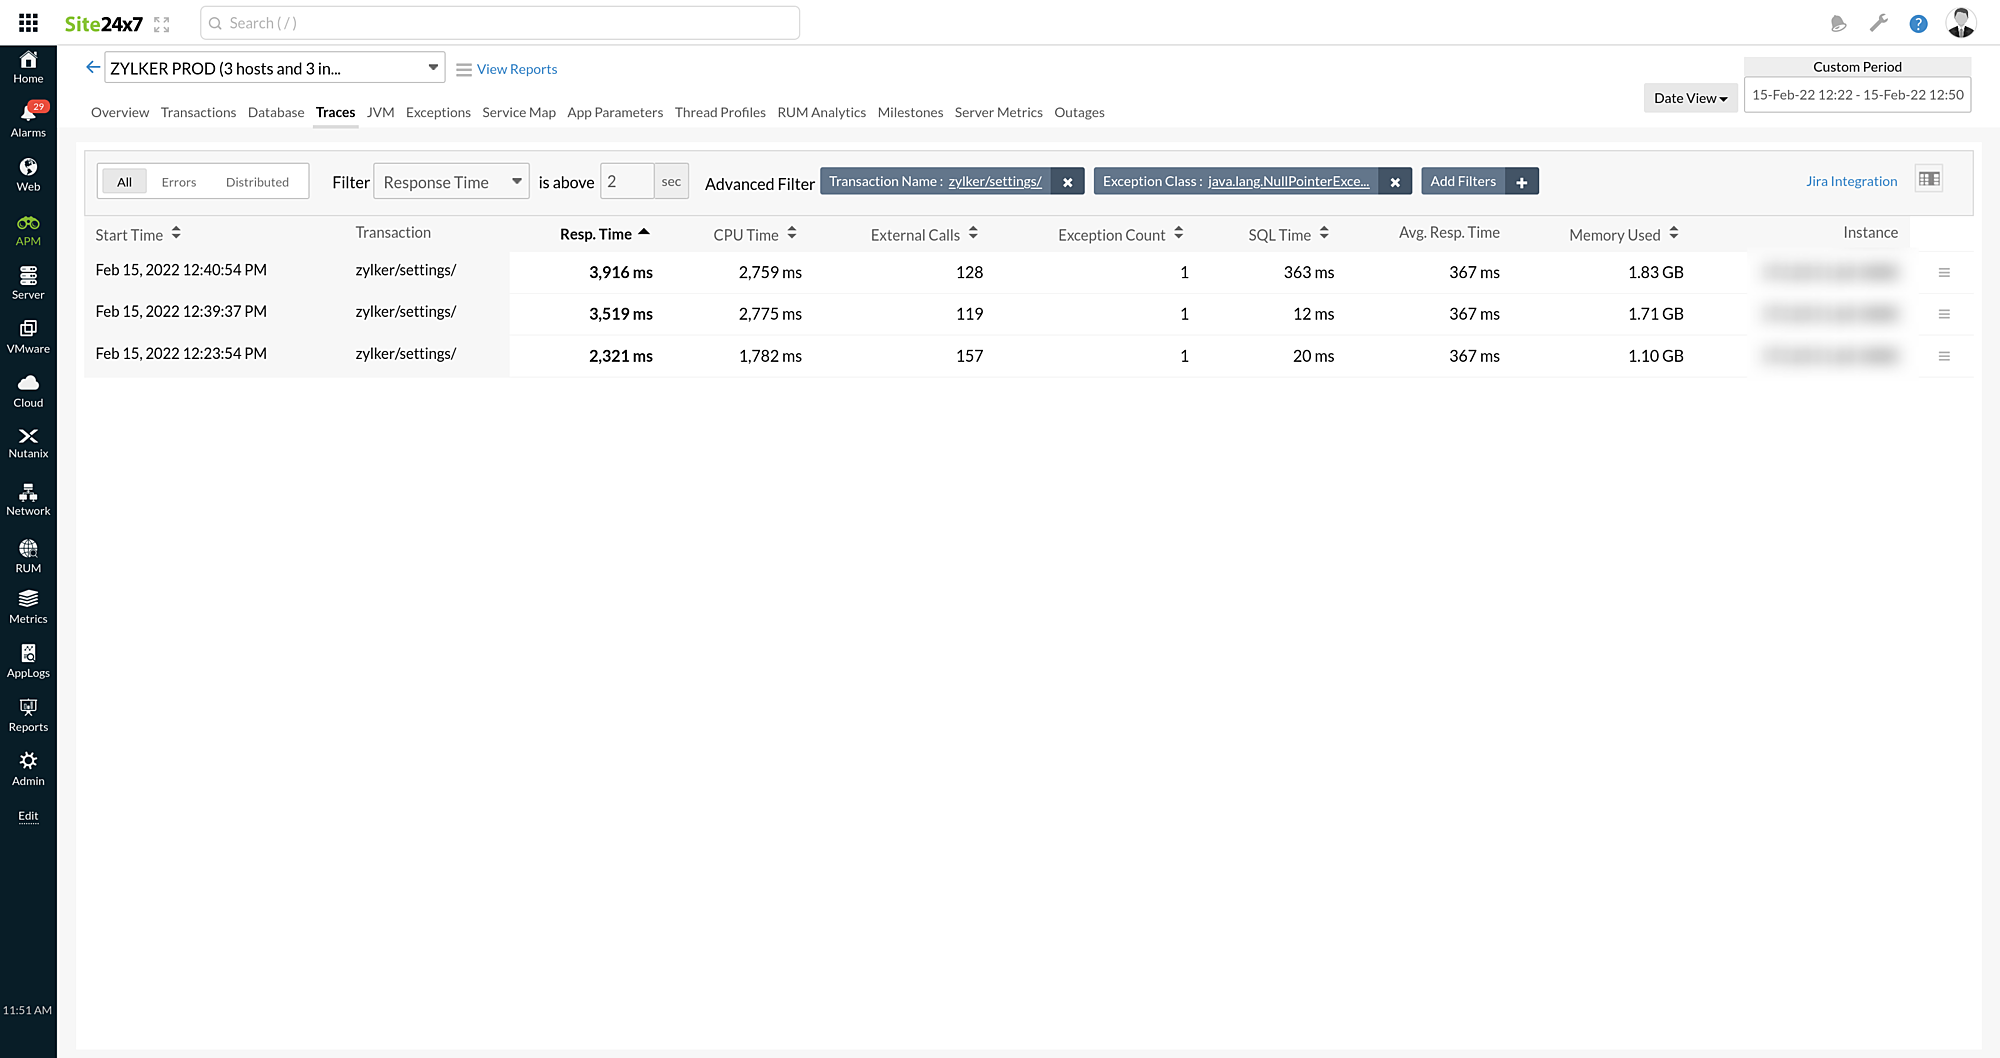
You can click the ![]() icon to view the performance of that particular transaction.
icon to view the performance of that particular transaction.
You can view the whole picture of the required trace by clicking directly on it.
You can view the complete details of the trace by clicking it. From there, you can explore various parameters and metrics by accessing the following tabs:
- Summary
- Trace Details
- SQL Statements
- Remote(External) Calls
- JVM Metrics
- NodeVM's Metrics
- Server Metrics
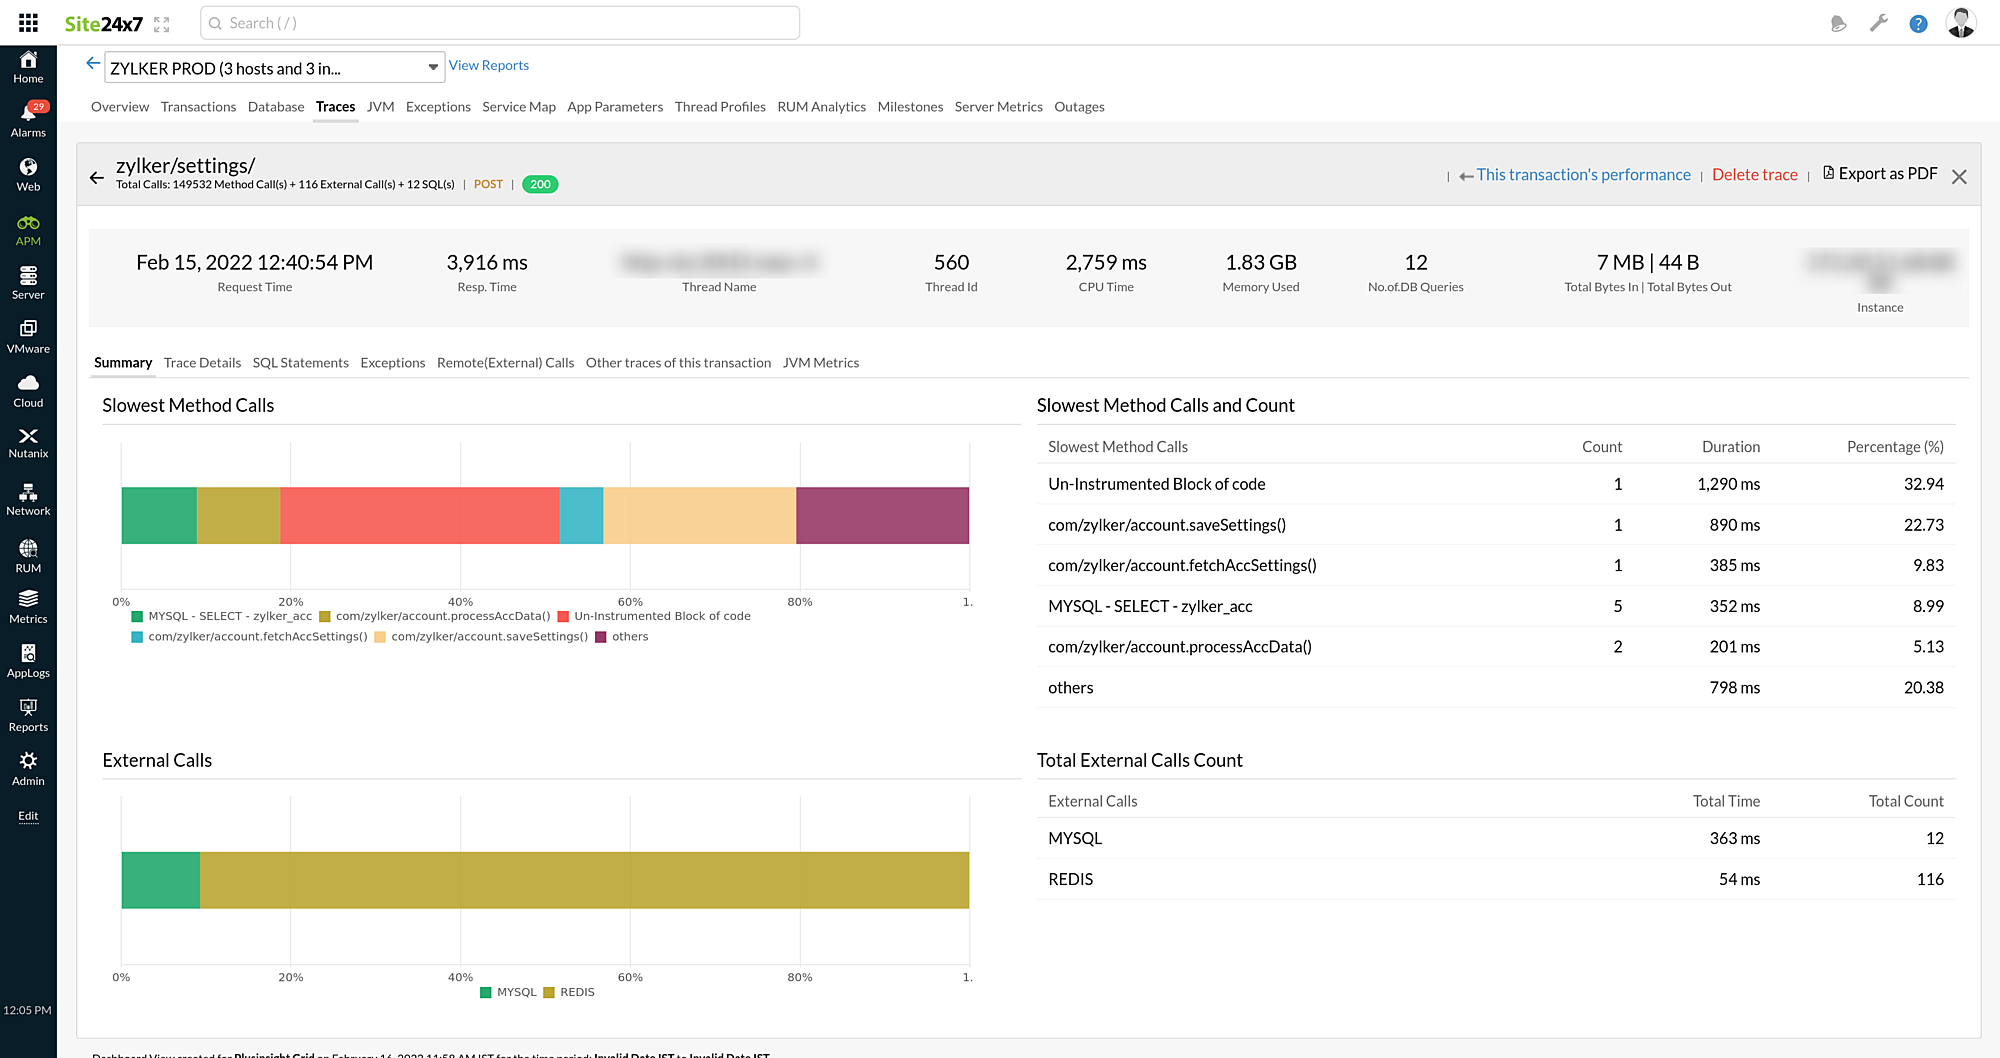
Summary
Gives an overall summary on the trace selected.
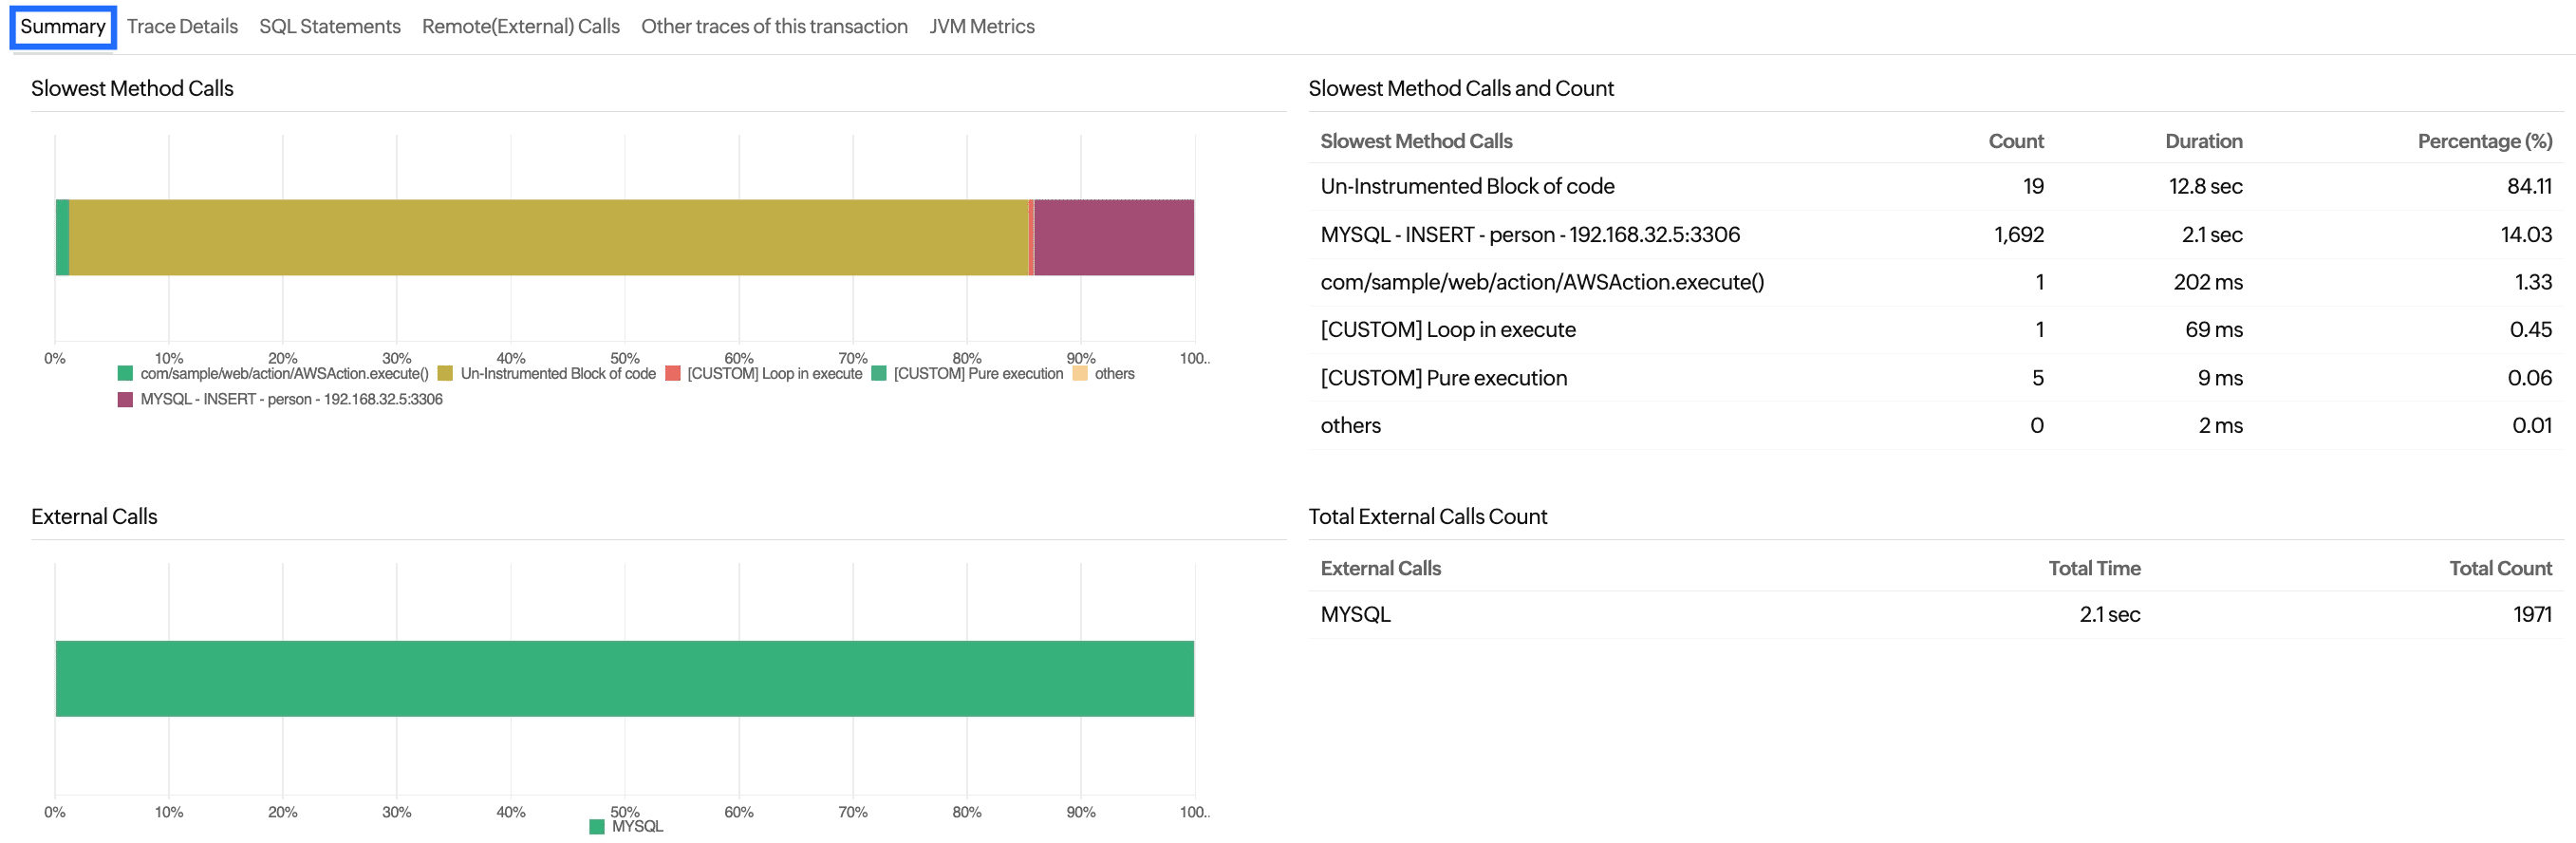
Slowest Method Calls
| Parameters | Description |
|---|---|
| Slowest Method Calls | The name of the slowest component. |
| Count | The number of times the component was called. |
| Duration | The time duration the component took to execute out of the total time the trace took to execute. |
| Percentage (%) | The percentage of time spent executing this component out of the total time taken. |
Un-instrumented block of code:
In general, the APM Insight agent captures known frameworks and methods in your applications. Components involved in a transaction, including its method calls and functions, are listed under the Traces tab.
While inspecting a transaction trace, you may encounter a field called un-instrumented block of code.
You may get this message under two circumstances:
- When you have used custom methods or functions in your application code.
- Even in known frameworks, the agent may not be able to track all methods or functions, called between two instrumented methods or functions. In such cases, that particular method or function is marked as an un-instrumented block of code. This helps you to identify the exact occurrence of the specific method. By knowing the time stamp and the instance of occurrence, you can deploy custom instrumentation to figure out the issue.
External Calls
| Parameters | Description |
|---|---|
| External Calls | The external calls made during the execution of the trace. |
| Total Time | The total time taken by the external call to complete. |
| Total Count | The number of times a particular call has been executed. |
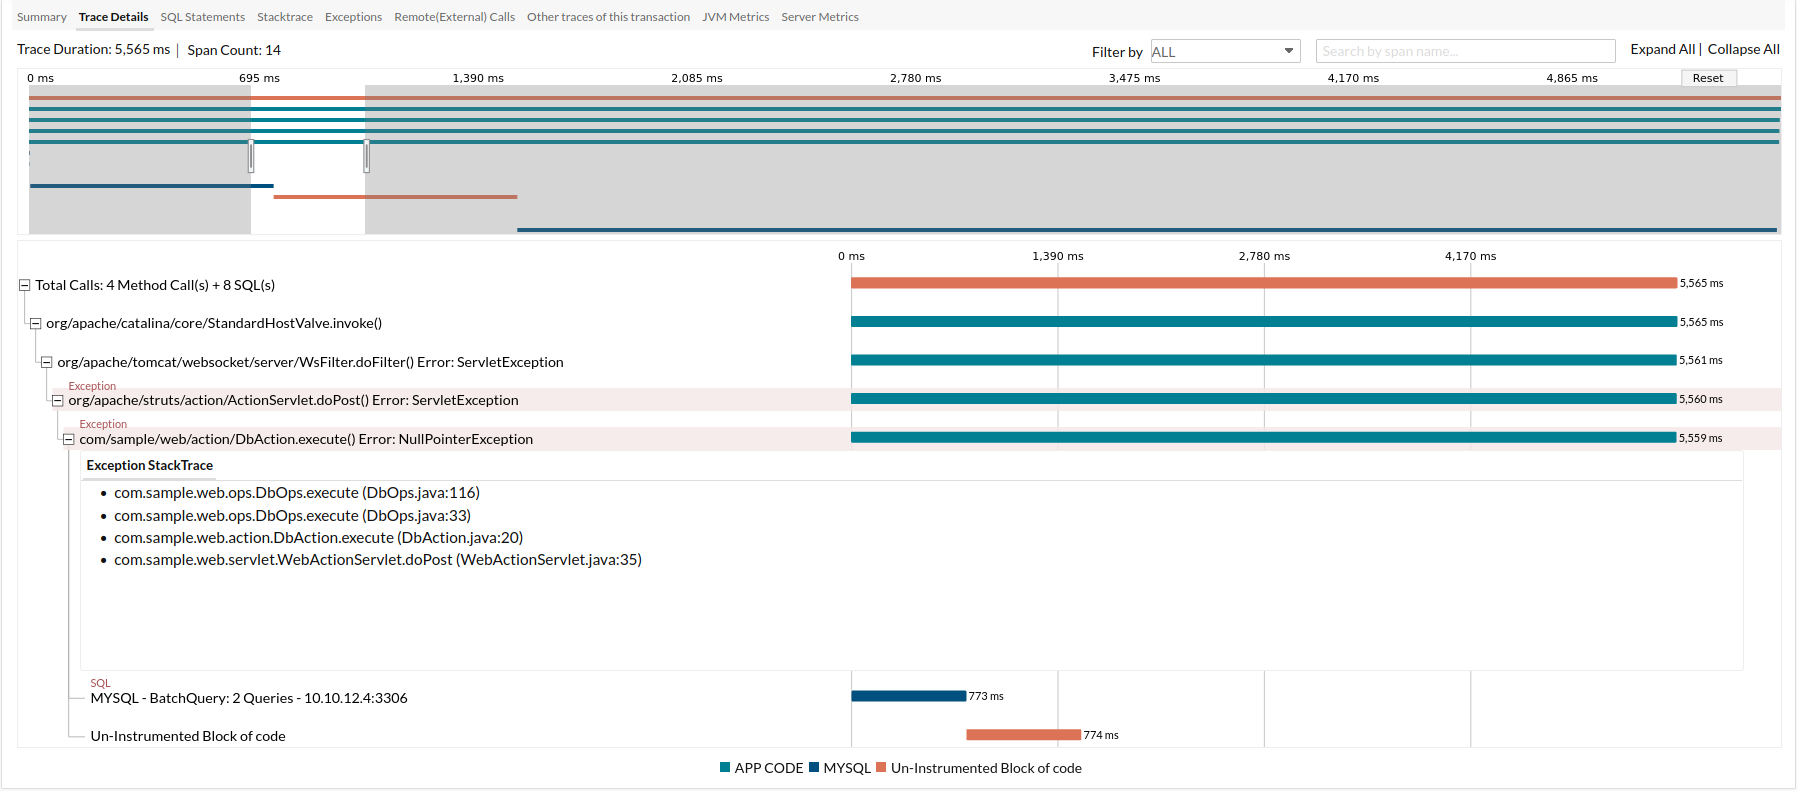
Trace Details
This tab allows you to dig deeper into all of the entities involved in the trace to identify the anomalous spans causing latency.
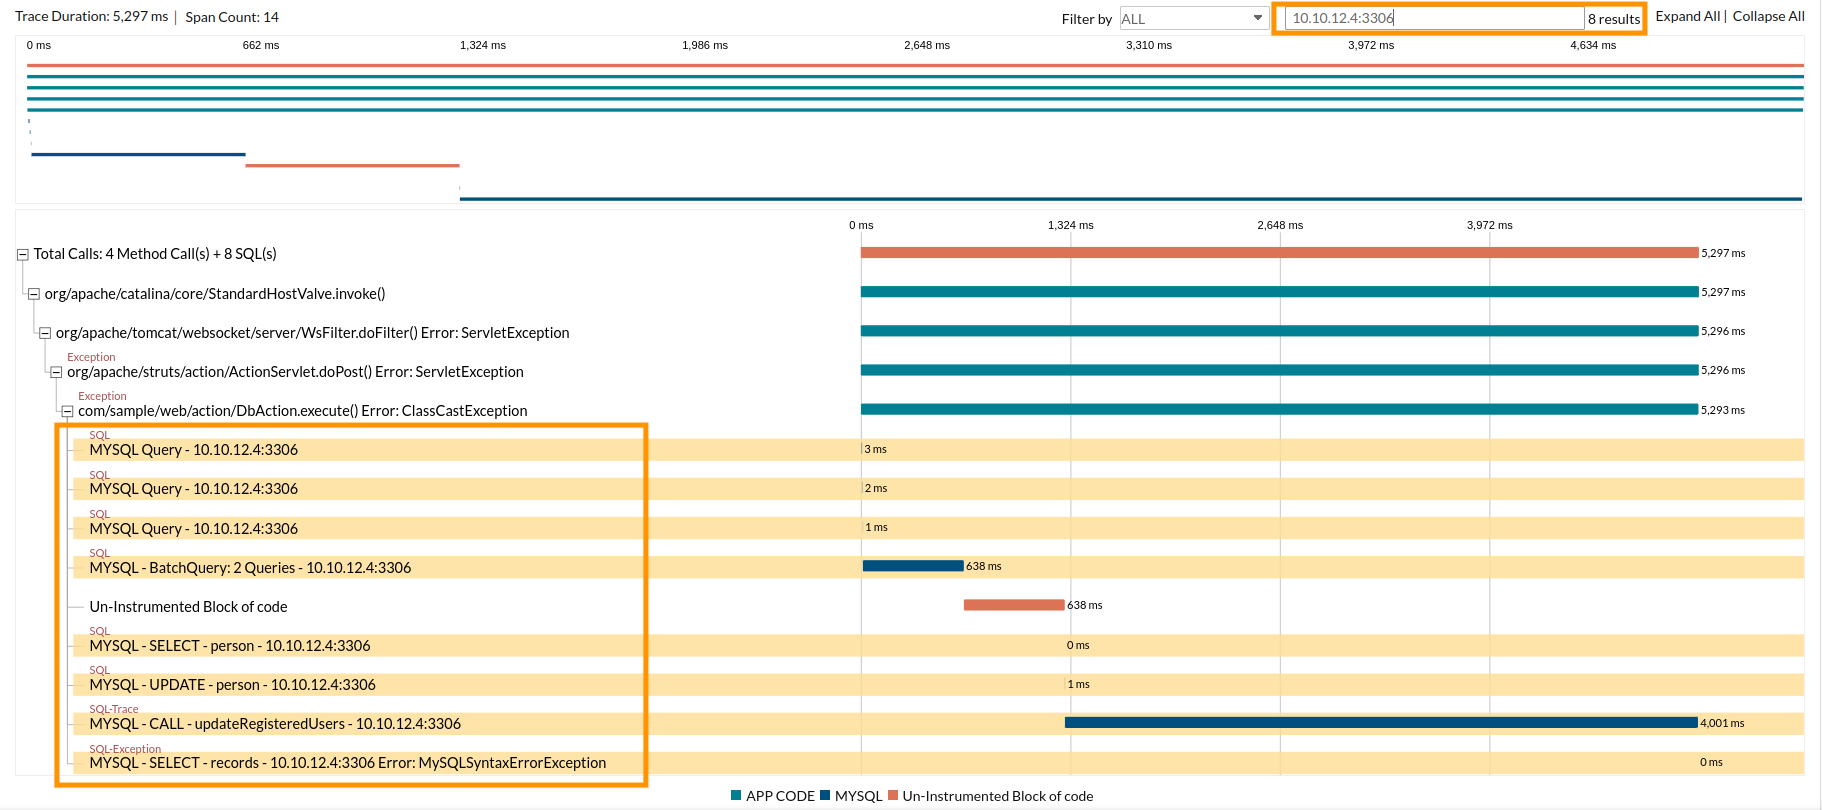
Header
This displays the total duration of the trace and the total number of spans in the trace. You can perform a quick search based on any of the trace types like APPCODE, MYSQL, WEBREQUEST, HANDLED_EXCEPTIONS, and ALL, by selecting it from the Filter drop-down menu.
You can also search for a span by its name using the Search by span name box as shown in the screenshot below.
Minimap
Gives a condensed view of the trace timeline. You can click and drag your mouse over the map to filter the spans of that time range. The filtered spans will be listed in the main timeline. If you want to select a different time range, click Reset and then select again.
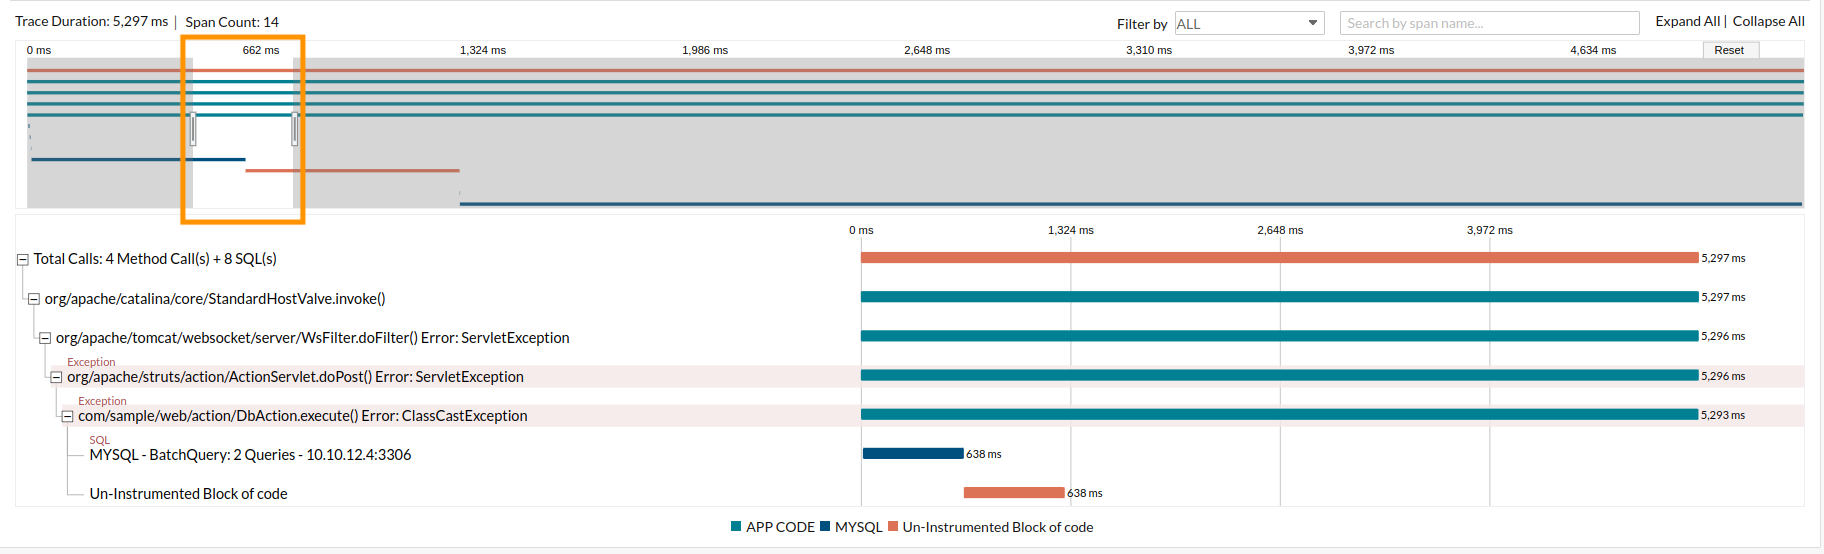
Minimap will not be generated for traces containing more than 1,500 spans.
Timeline
Shows the list of spans within the trace. You can also expand or collapse the span to view the children spans.
The screenshot below shows the expanded span.
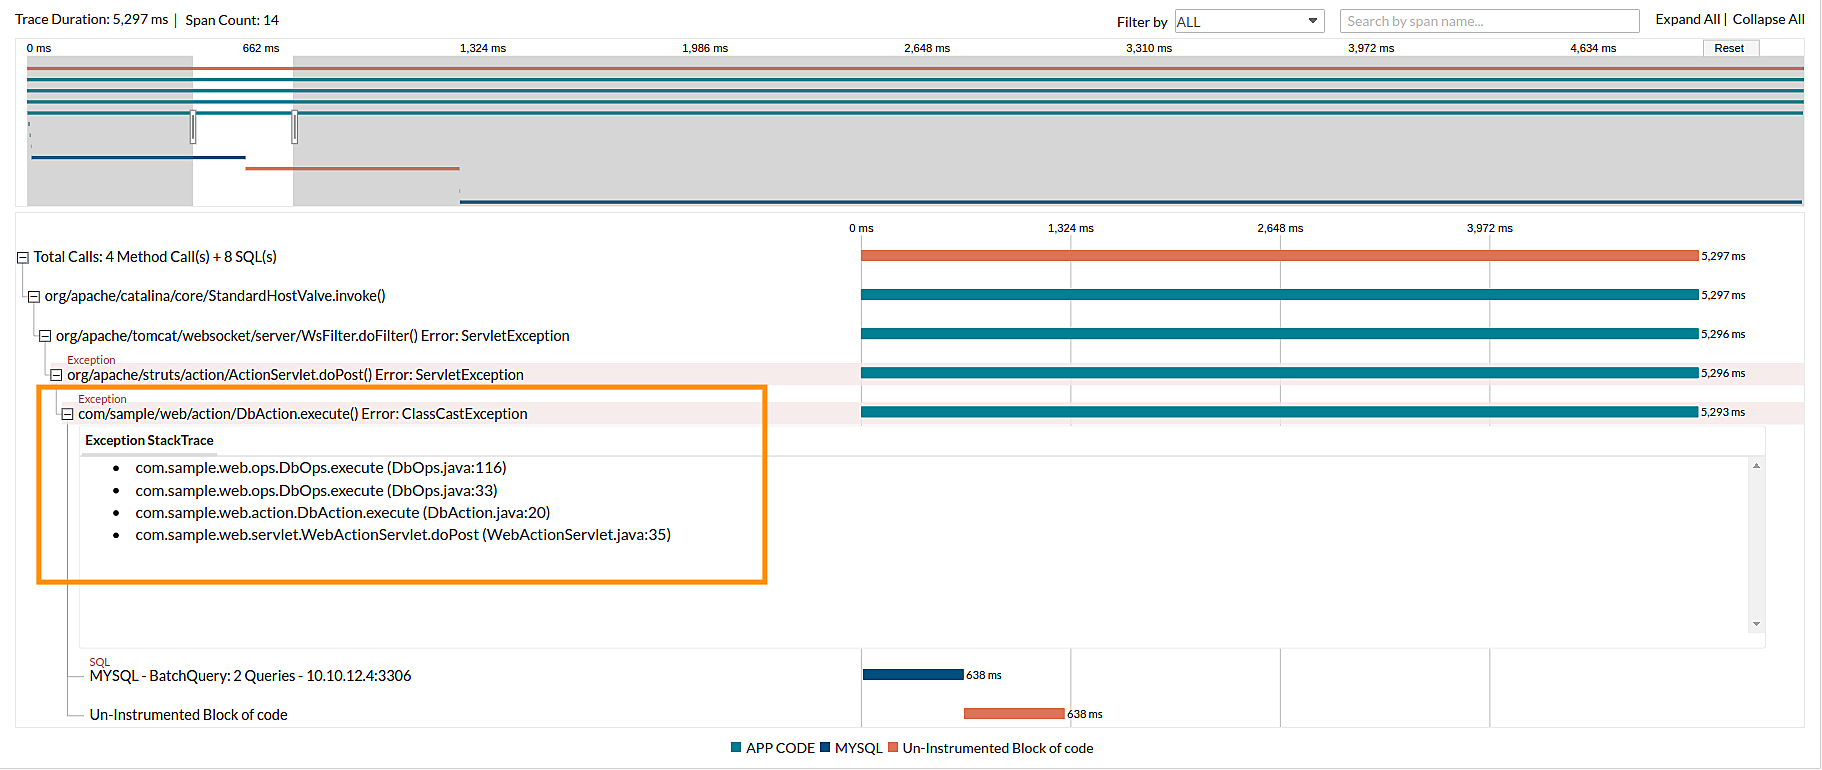
- The timeline bar is color-coded based on the span type.
- By default, all spans are expanded except those with a time duration less than 30% of the total trace duration.
- The spans containing exceptions are highlighted in red.
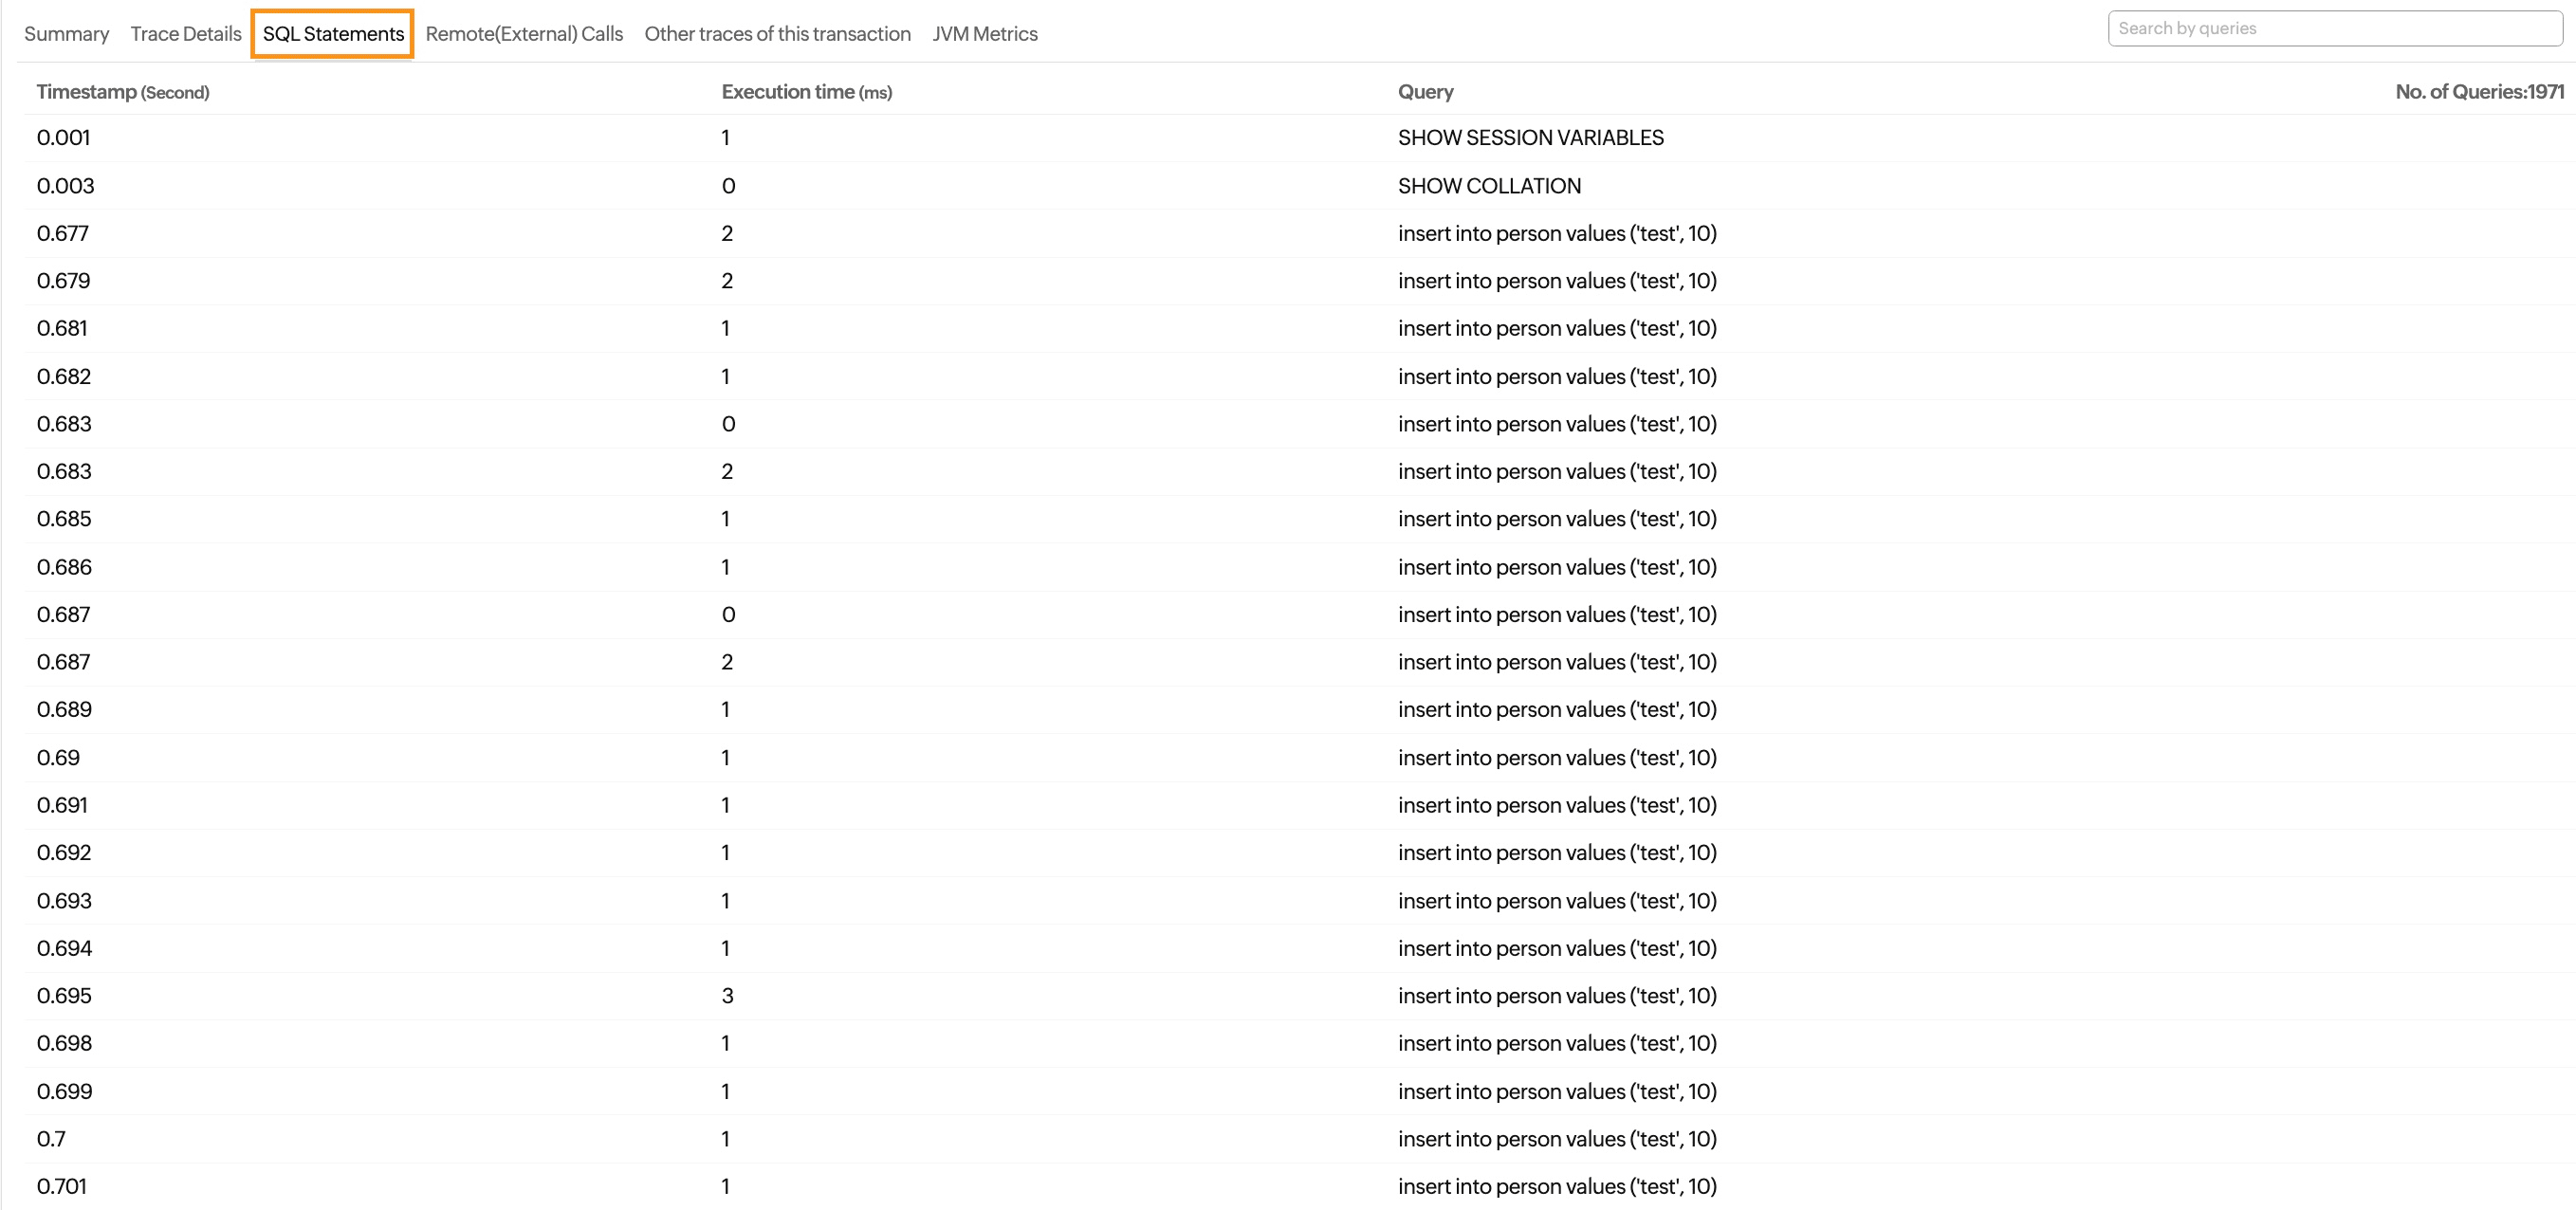
SQL Statements
Information on all the SQL queries executed by the trace.
| Parameters | Description |
|---|---|
| Timestamp (second) | The time when the SQL query was executed by the trace. |
| Execution time (ms) | The time taken by the query to complete on its own. |
| Query | The name of the query executed. |
| No. of Queries | The total number of queries executed. |
Remote(External) Calls
This lists down all the external remote calls made during the execution of the trace. All the external calls made are identified and listed down under two classifications: ALL and MYSQL.
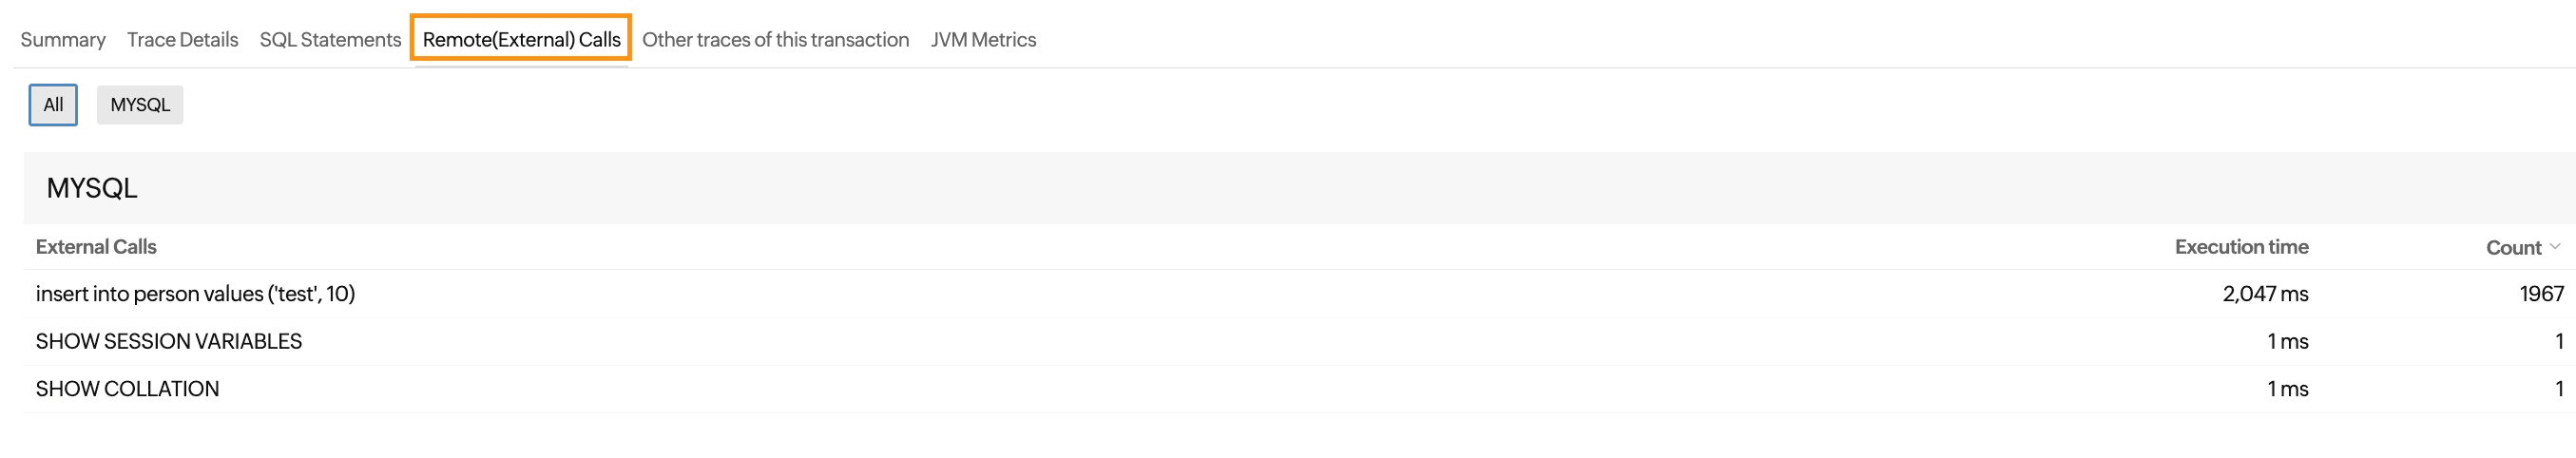
To know more about how external calls are tracked, please see our blog on tracking external calls.
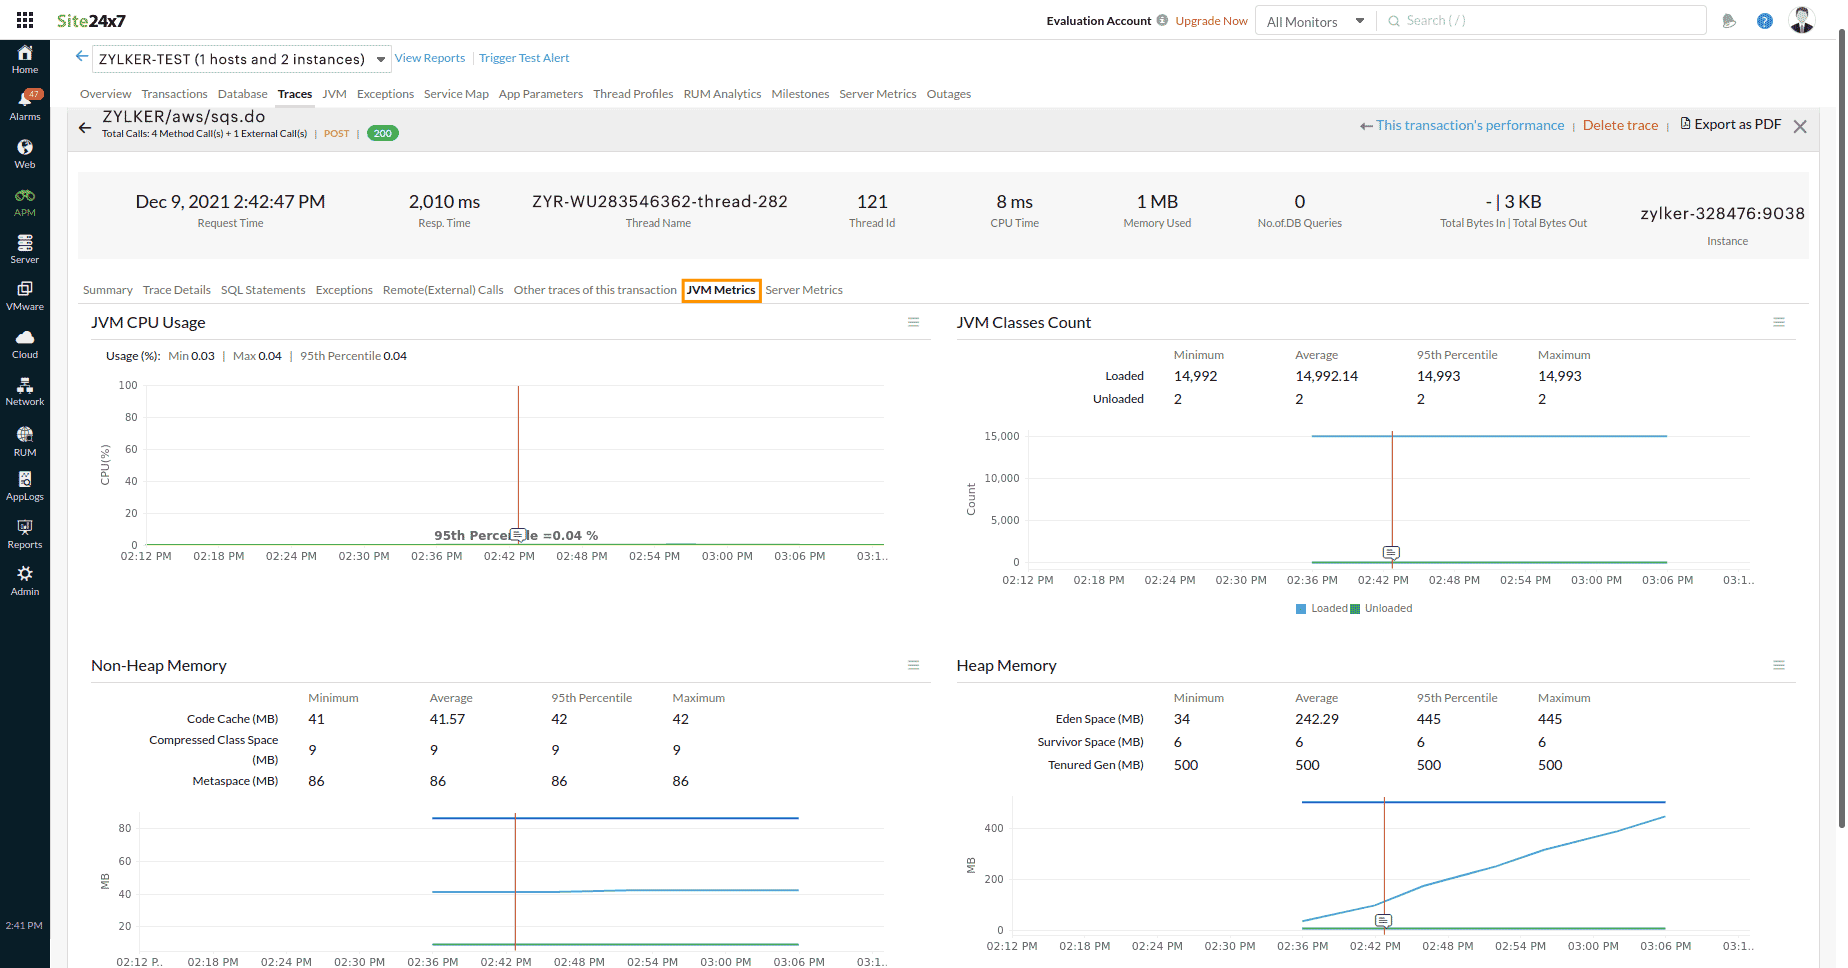
JVM Metrics
This tab is visible only for the Java application.
For Java applications, you can navigate to Traces > JVM Metrics to get the graph views of important JVM metrics, such as JVM CPU Usage, JVM Classes Count, Heap Memory, and Non-Heap Memory, before and after the trace start time. The red mark on the graph indicates the trace's start time. The user can obtain troubleshooting information by comparing the key metrics during the execution of the transaction.
NodeVM's Metrics
This tab is visible only for the Node.js application.
For Node.js applications, you can navigate to Traces > NodeVM's Metrics to get the graph views of CPU metrics, garbage collection data, and event loop data, before and after the trace start time. The red mark on the graph indicates the trace's start time. The user can obtain troubleshooting information by comparing the key metrics before and after the tracing.
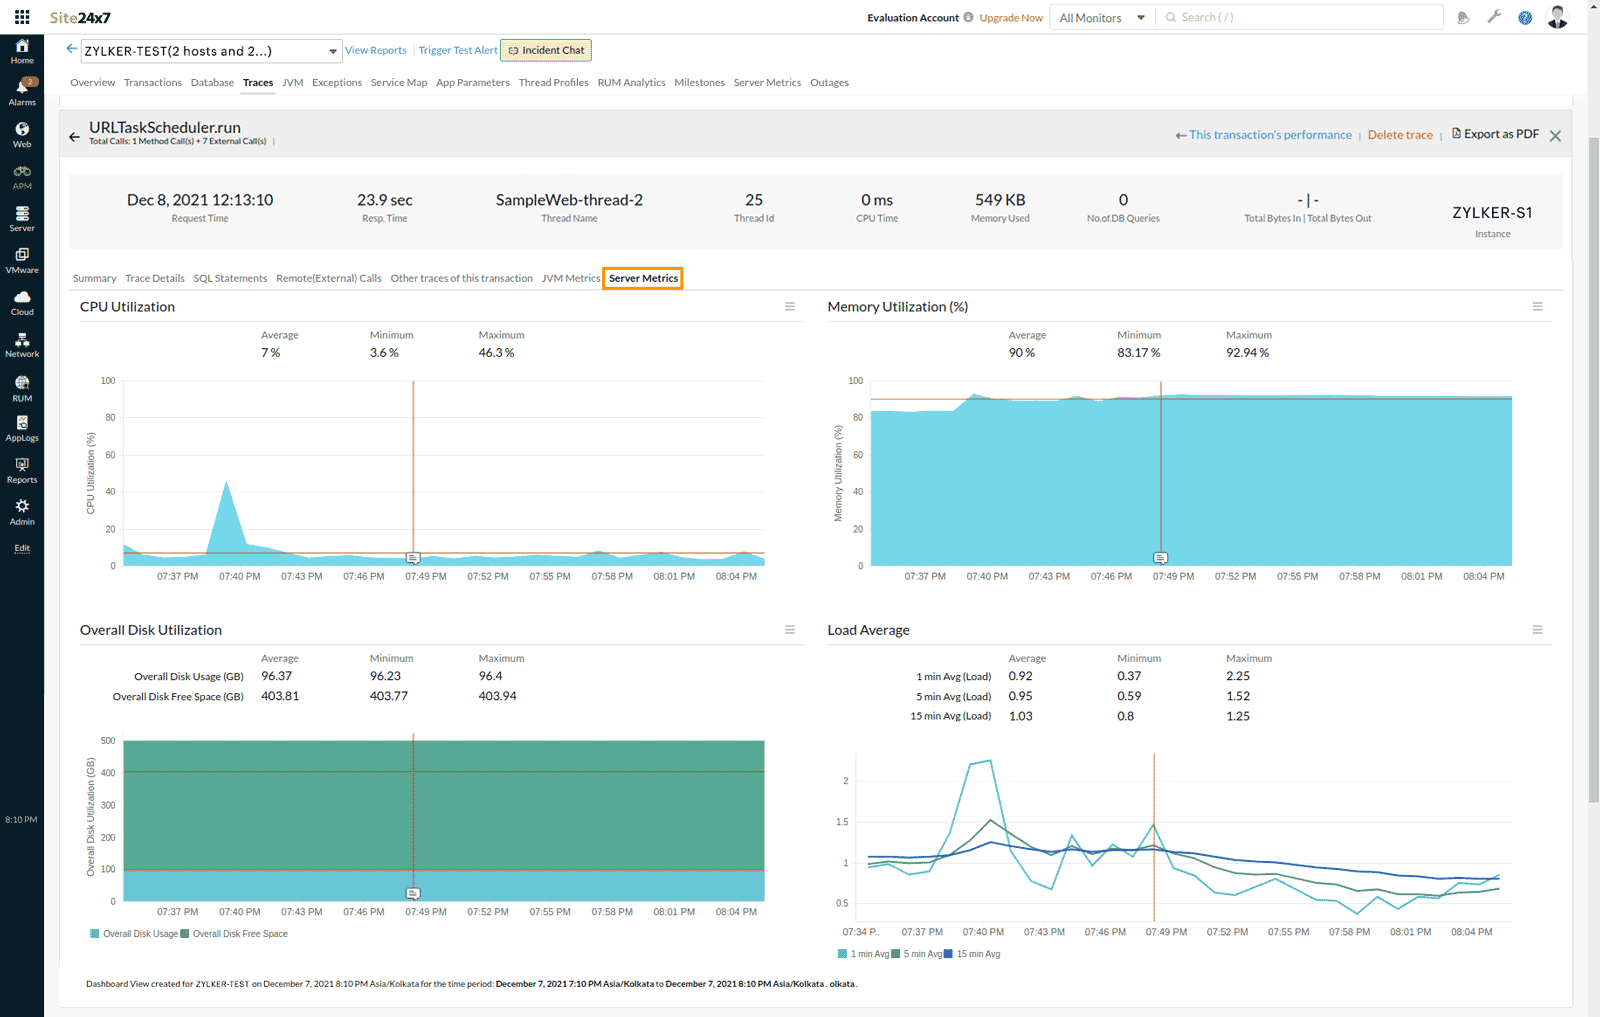
Server Metrics
This tab is only visible if you have a server monitor mapped to the instance.
Navigate to Traces > Server Metrics to see graph views of the server's important metrics before and after the trace start time. The red mark on the graph indicates the trace's start time. This helps the user to get information on the status of the corresponding server at the specified time.
JVM (Only available for Java agent users)
This tab is only visible for Java applications. It provides insights into runtime data, CPU usage, memory distribution, garbage collection, and thread activity, which can be used to monitor application health and troubleshoot performance issues. Learn more.
IIS (Only available for .NET agent users):
This tab is available only if you have enabled APM Insight in IIS monitor console and only if you are using a .NET agent. To know more about how to enable APM Insight in IIS monitoring, please go through our blog on the same topic. Various parameters and metrics can be obtained by accessing the following tabs:
- Summary
- Application Pools
IIS - Summary:
Gives an overall view on the IIS server and the application accessing the server.


IIS - Application pools:
Information on all the application pools that are running on the IIS server.


Node VM
The Node VM tab is available only if you are using the Node.js agent. The Node.js agent uses Node VM, a native node add-on, that collects key metrics data from the Google Chrome V8. The agent collects CPU metrics, which are usually analyzed with garbage collection (GC) metrics. These metrics help you in improving the performance of your application.
Exceptions
This tab shows descriptions of all the exception types that have occurred, with a count of how many times they have taken place.
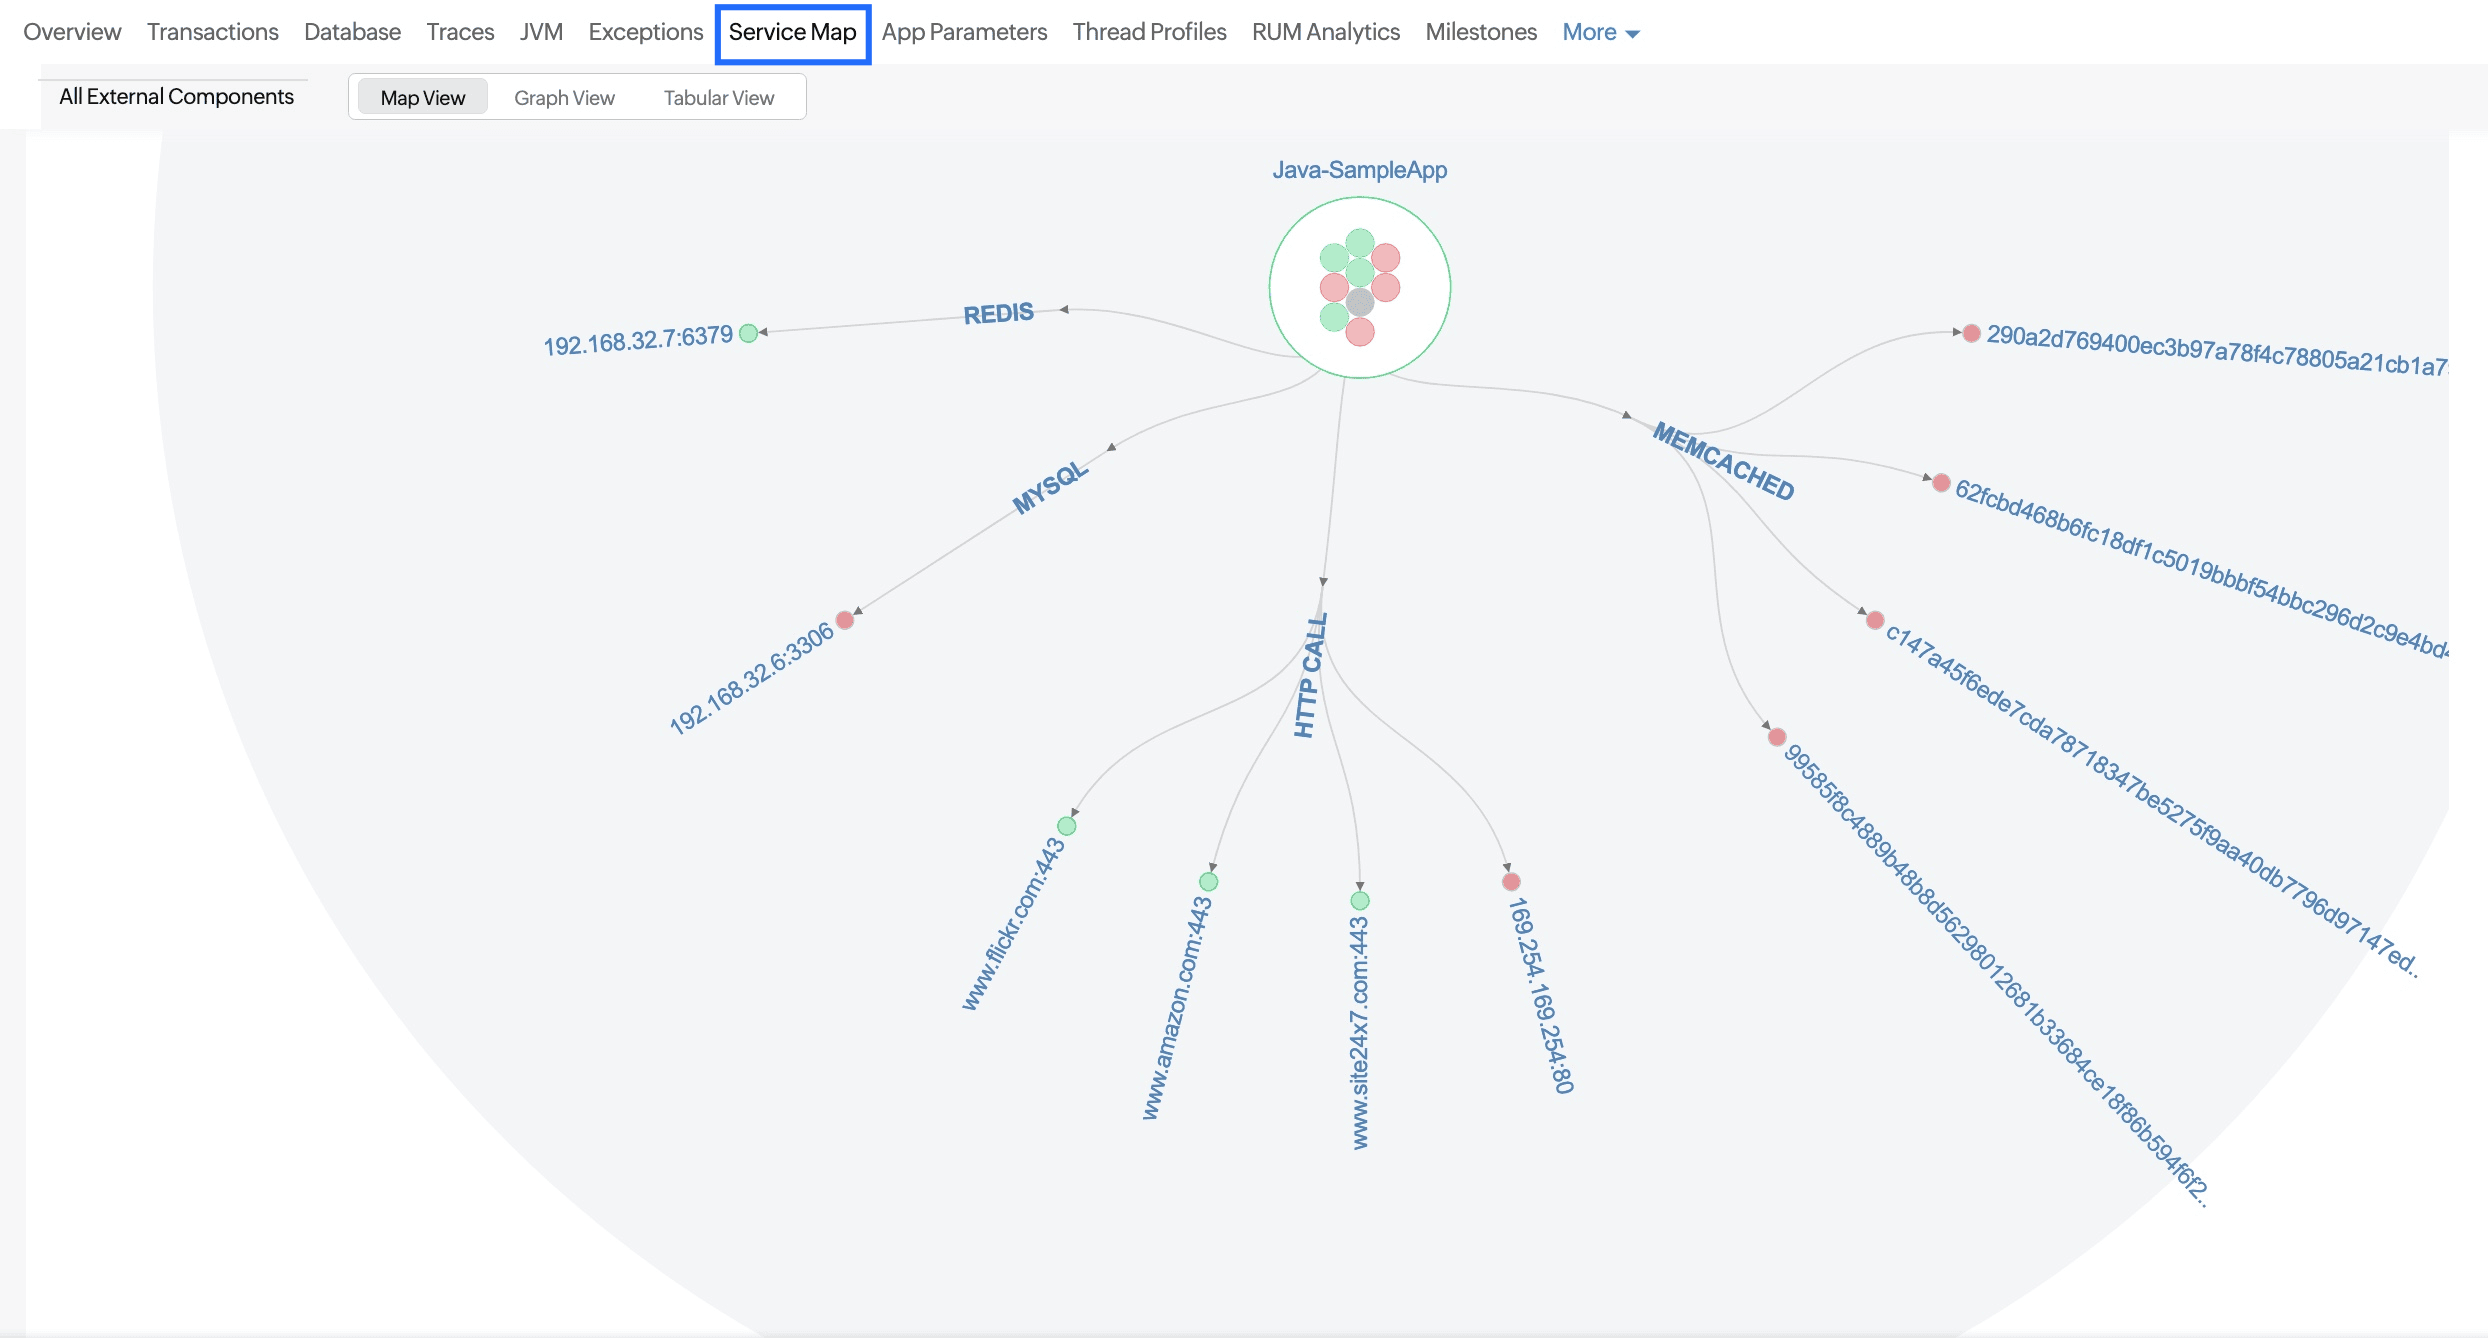
Service Map
The Service Map tab gives you a comprehensive picture of your application infrastructure and its dependencies. It provides valuable insights into various aspects of the performance and health of your application and dependencies. Here’s how it can benefit you:
- An application overview: Get a clear visualization of your entire application infrastructure that highlights how different components are connected and how they interact with each other.
- Real-time statuses: Understand the health of your application, instances, and associated servers by checking the status of each node: Green means healthy, and red means unhealthy.
- Key metrics: Obtain key metrics for each node, like the IP, average response time, total number of requests, number of failed requests, error count, error rate, and throughput.
- The failed request count: Keep a count of failed requests to quickly identify and address issues causing these failures in order to maintain the reliability and stability of your application.
This tab helps you understand the architecture and identify potential bottlenecks or points of failure, allowing you to troubleshoot your application problems before your customers are impacted.
Views
You can view the metrics in three different views: the Map View, Graph View, or Tabular View. The Map View is shown by default.
App Parameters
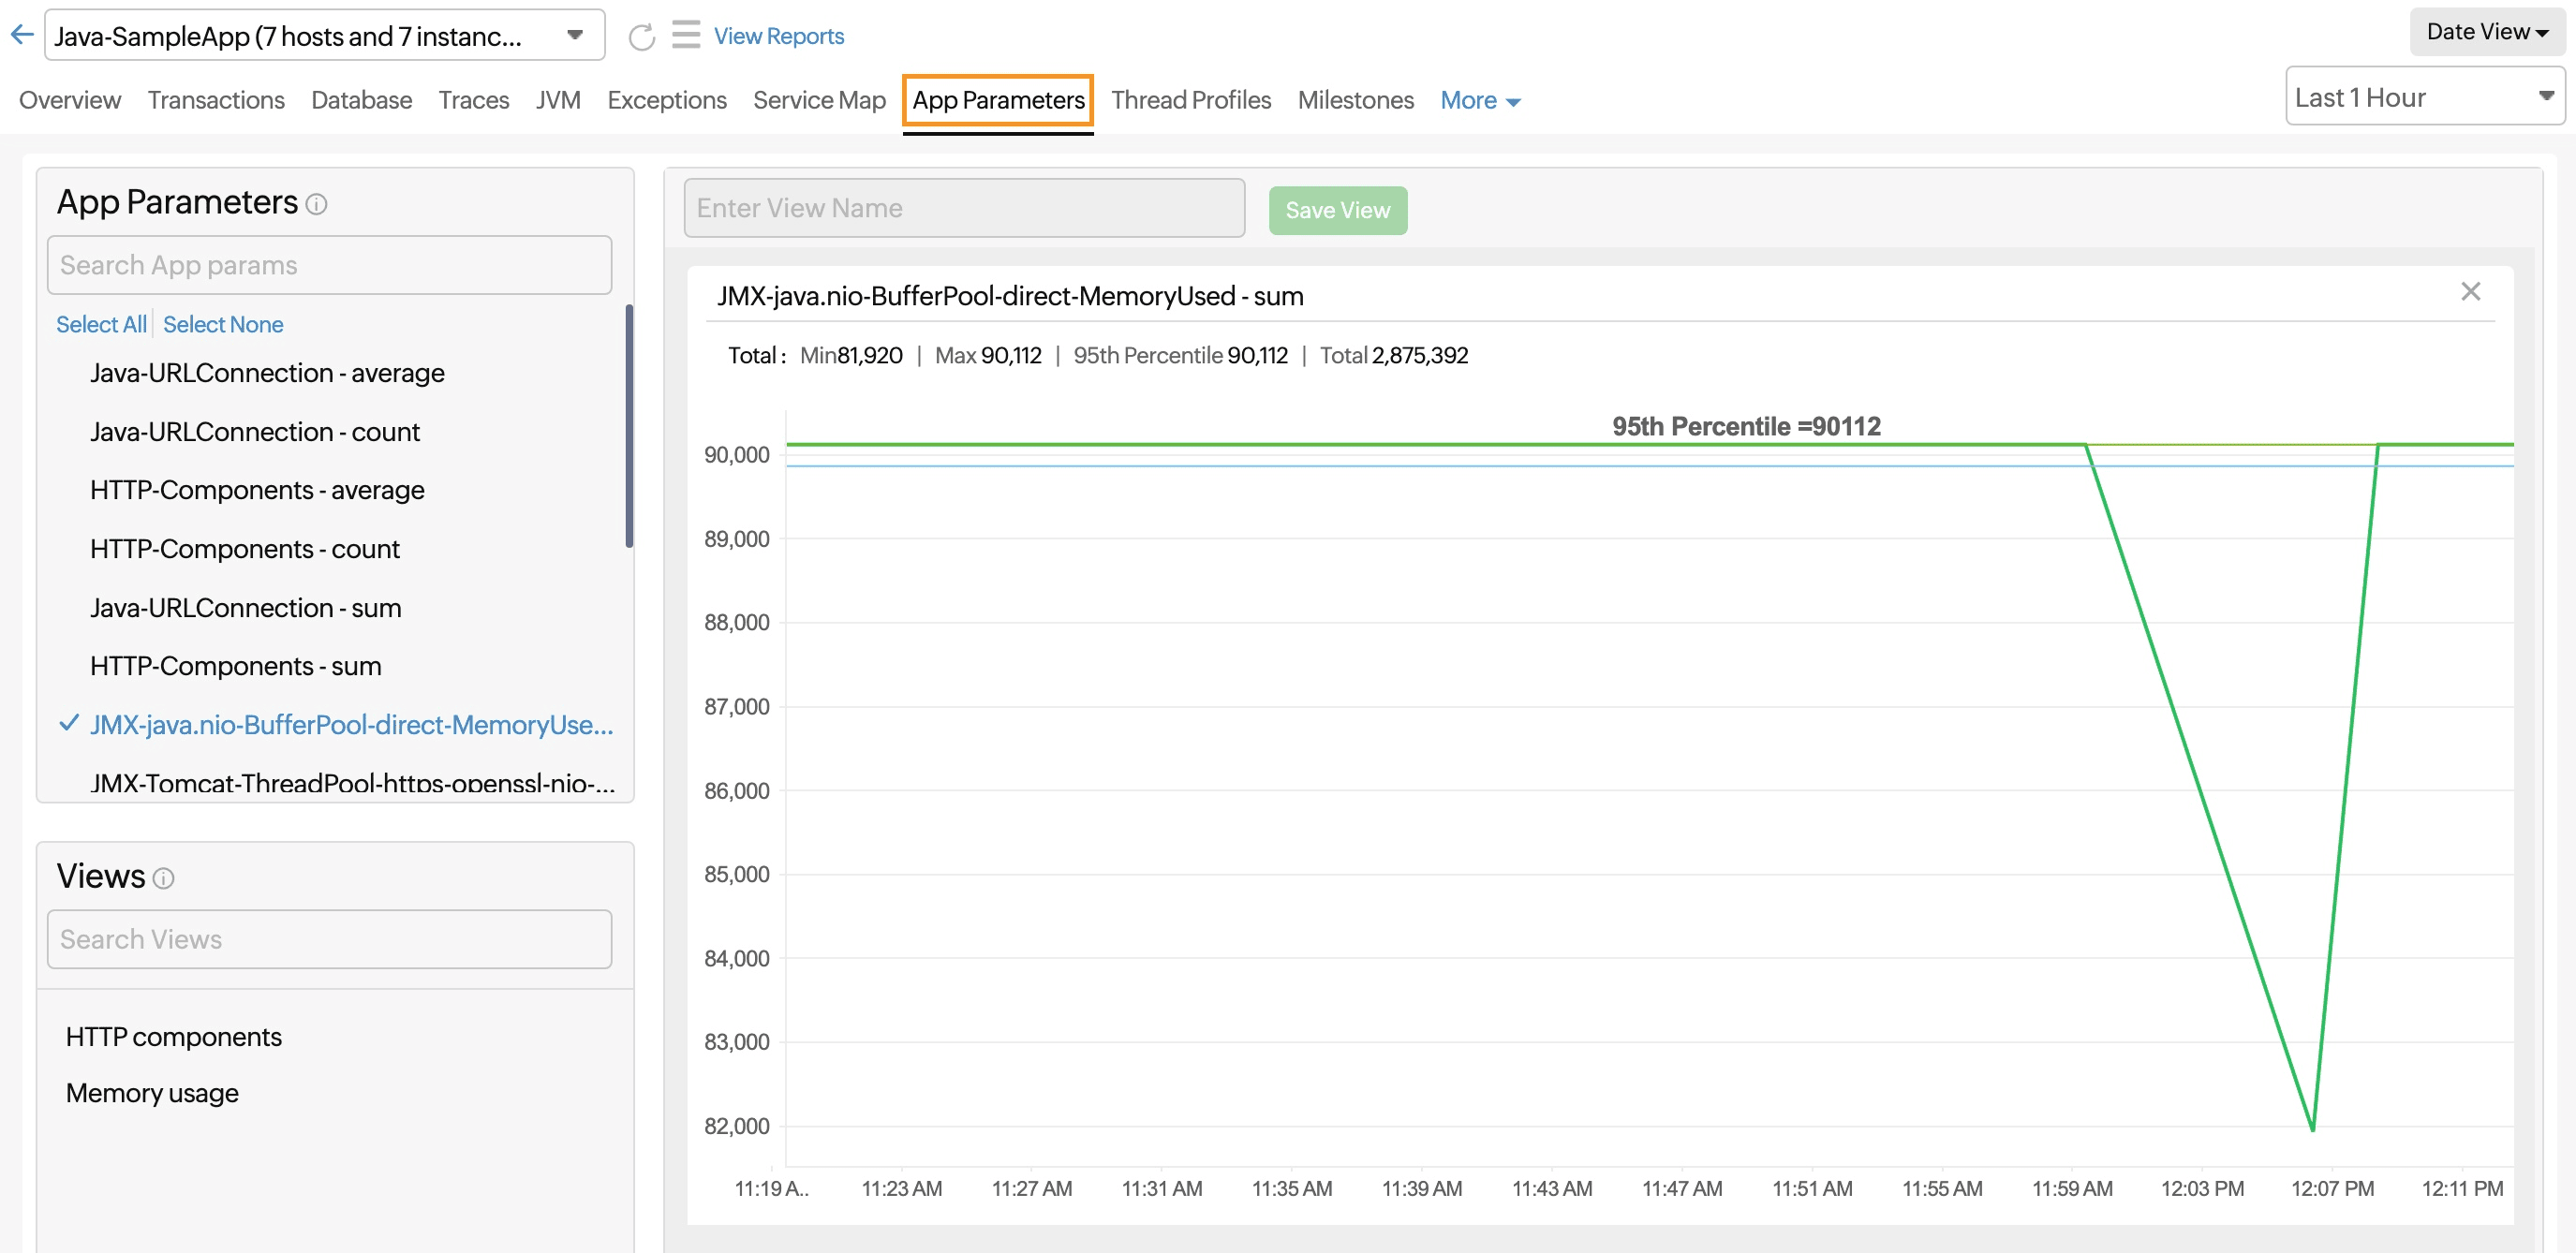
This tab is only visible for Java and .NET applications.
The App Parameters tab allows you to create, monitor, and analyze custom parameters related to your application's performance.
View created parameters
On the left side, you can see a list of app parameters that have been created for your application. Each parameter has a:
- Name: The name you have provided for the parameter
- Type: The type of parameter, such as a sum or average
You can directly click the parameter you wish to view. This will display detailed information and graphical representations related to that parameter.
Save a custom view
- You can create a custom view by selecting the parameters.
- Once you have configured the view, you can save it for future reference by entering a view name and clicking the Save View button.
Once saved, the view will be added under Views on the left pane.
You can also select any view from the left pane to update or delete it.
Thread Profiles
This tab is only visible for Java and .NET applications.
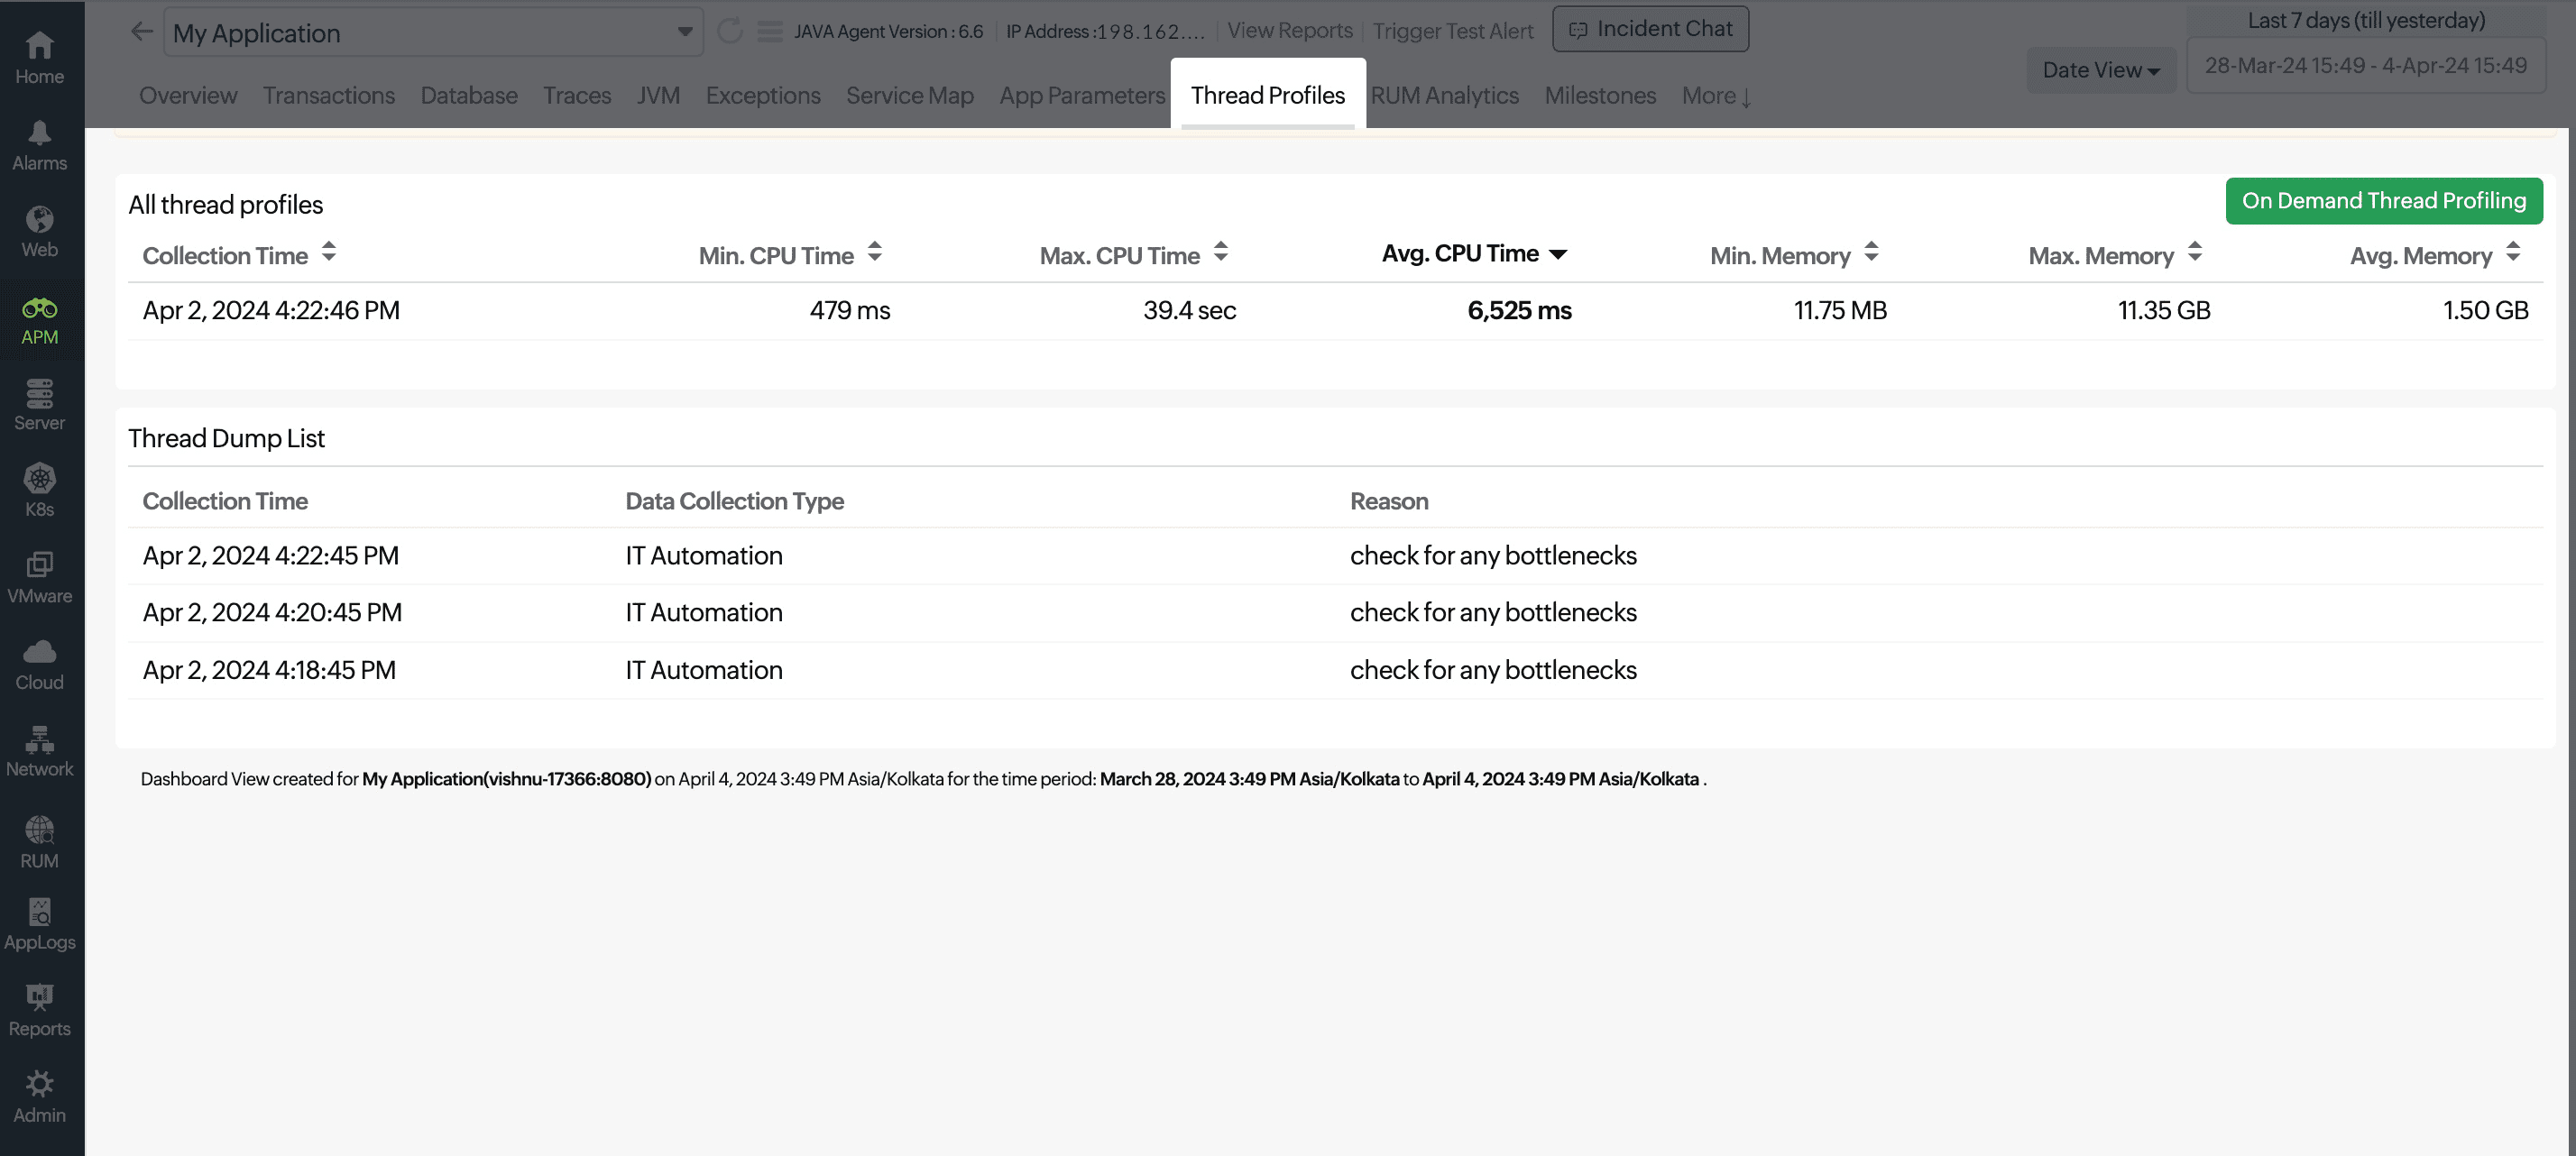
The Thread Profiles tab allows you to collect and analyze thread dumps. By analyzing these dumps, you can identify threads that are stuck, waiting, or consuming a lot of the CPU.
Check out the Thread Dump Analysis feature to explore more about thread profiling.
Milestones
In general, you can mark milestones to review your application performance before and after a feature update, issue fix, performance enhancement, and more. You can view all such created milestones under the Milestones tab. Milestones created for the corresponding application in the chosen time period are listed here.
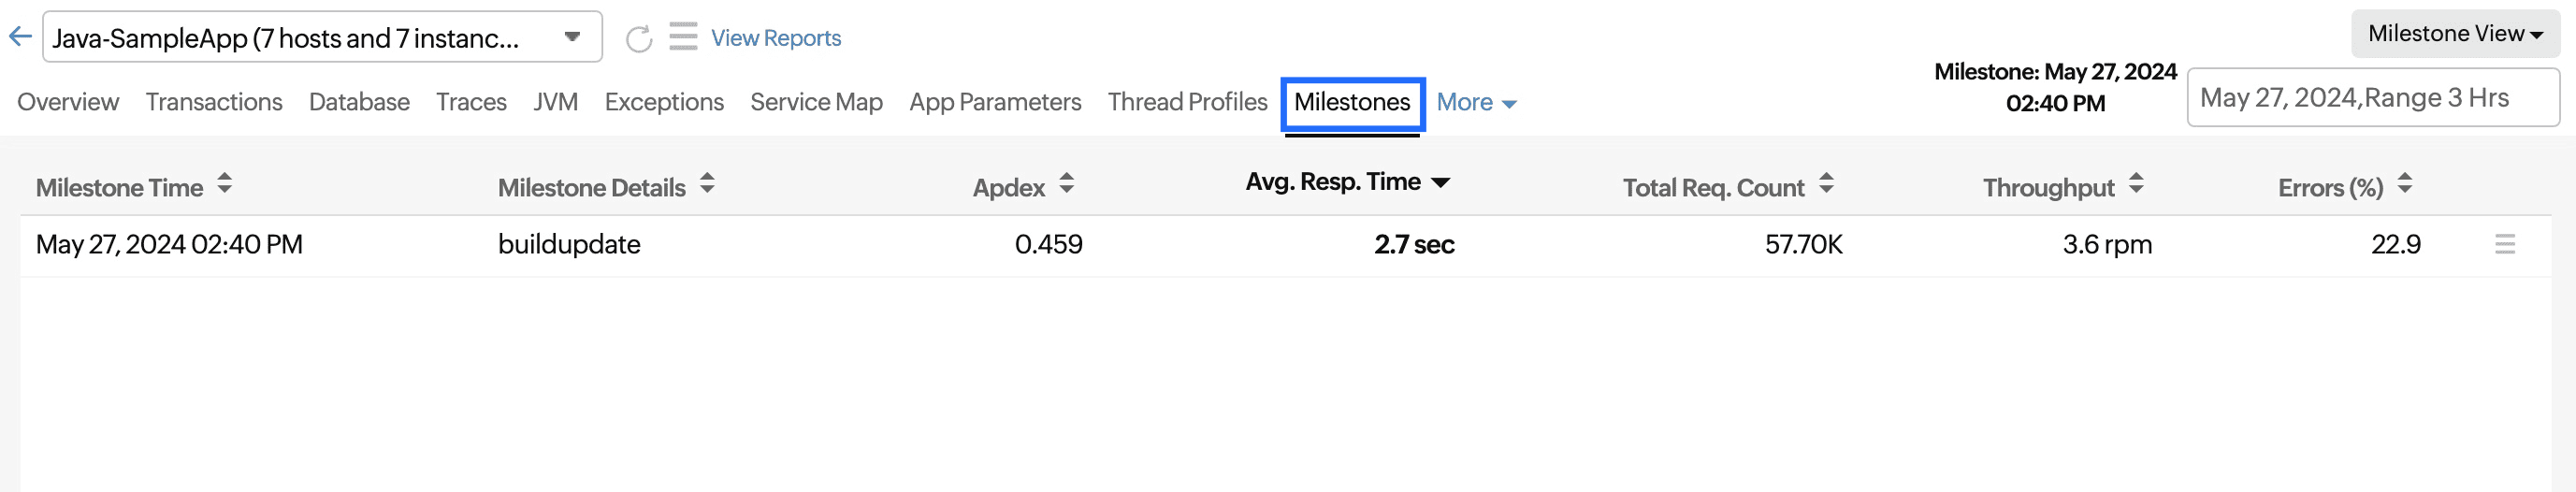
Only the milestones created at the monitor level are displayed here, while those created at the group and global levels can be viewed on the Admin tab. Learn more.
Clicking a particular milestone displays your application's metrics before and after the selected time period.
The following metrics can be compared using milestone markers:
- Apdex Score
- Average Response Time
- Request Throughput
- Request Count
- Data Throughput
- Errors (%)
- Exception Count
For example, by clicking the buildupdate milestone, you can view the application's performance both before and after a three-hour period.
RUM analytics
This is an interface tab that shows all the important data collected by the Site24x7 APM Insight RUM agent.
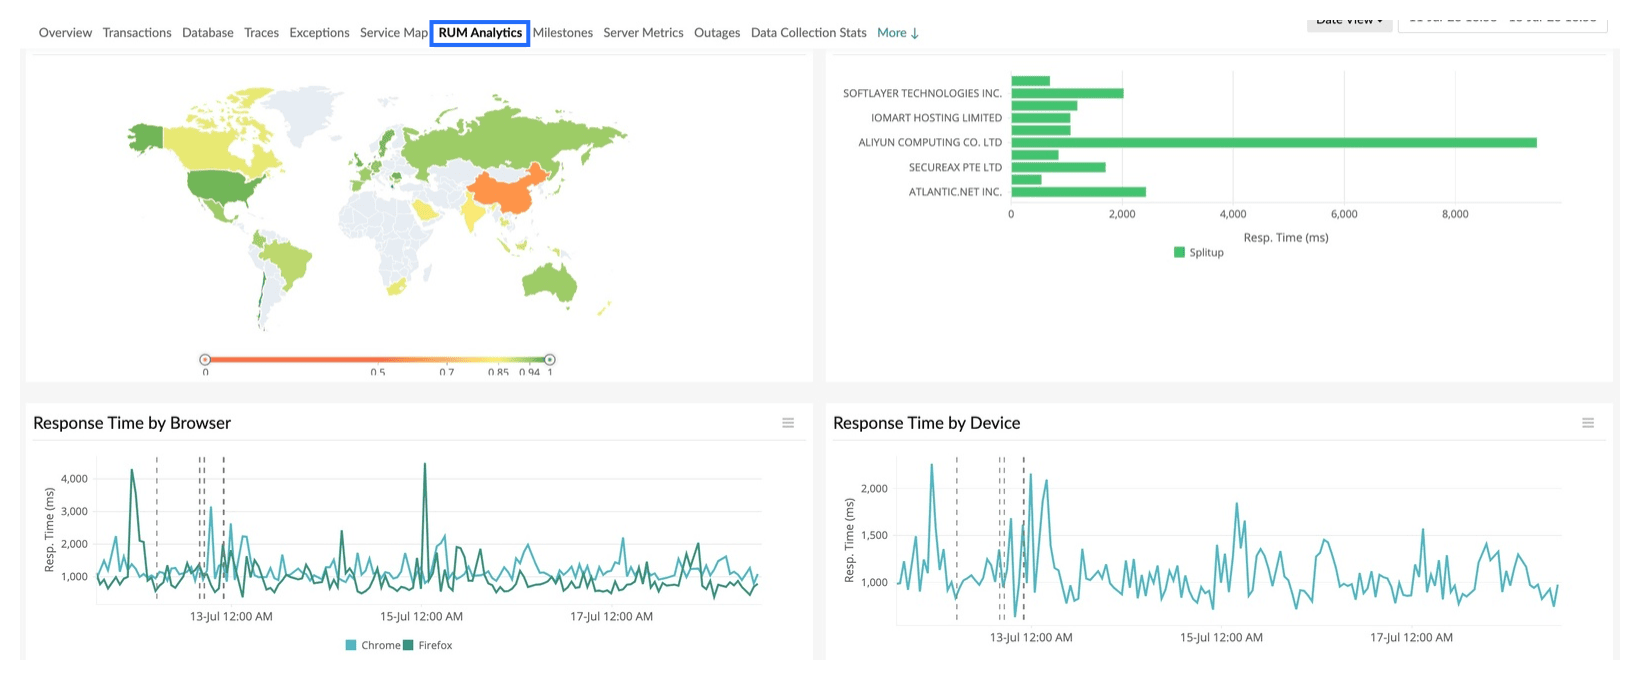
You can enable RUM effortlessly in your Java and PHP applications through the automatic RUM injection feature.
Server Metrics tab
In general, you can see a comprehensive list of all the server monitors mapped to the instances of your application. You can also view the server metrics at the instance level and application level separately. Learn more.
Application-level metrics
If you choose the application name from the top-left menu, you will get the complete list of the server monitors associated with your application.

You can view the whole picture of performance metrics by clicking on the server monitor.

Instance-level metrics
If you choose the instance name from the top-left menu, you will get a thorough picture of all the major performance metrics of the associated server.

Outages tab
Gives an overall summary on the Down, Trouble, Critical history of the selected Application/Instance with information on Start Time to End Time, Duration, Reason, Comments.
| Parameters | Description |
|---|---|
| Start Time to End Time | The start and end time of the detected outage |
| Duration | The time duration of the detected outage |
| Reason | The reason for the detected outage for quick troubleshooting |
| Comments | Comments added by the user for reference |

You can click the ![]() icon to mark an outage as maintenance, edit comments, or even delete any outages if it is irrelevant.
icon to mark an outage as maintenance, edit comments, or even delete any outages if it is irrelevant.

Mark as Maintenance
You can mark a specific outage period as maintenance using the Mark as Maintenance option. After marking an outage as maintenance, the status icon changes to maintenance and the record is still available under the Outages tab. The maintenance can be reverted to outage if needed.
Data Collection Stats
You can get a detailed data report for a specific outage by clicking the hamburger icon and selecting the Data Collection Stats option.
Edit Comments
During any detected outage, Site24x7 will auto-populate the reason for the outage under the Reason section. Anyone, irrespective of the user role, can edit/delete these system-generated comments using the Edit Comments option.
Delete
You can delete any outage or maintenance that is irrelevant using the Delete option.
- You can also add an outage manually if needed using the Add Outage button.
- You can use the Download CSV button to export the displayed Outage report.

Data Collection Stats tab
The Data Collection Stats tab gives a detailed data report of the selected application or instance for the chosen time period. The data report will be available for the last 30 days.
Refresh the page manually to view the data report for the most recent polls.

| Parameters | Description |
|---|---|
| Status | The status of the monitor, like Up, Down, Trouble, or Critical |
| Apdex | A metric for user satisfaction, with 1 being the highest and 0 being the lowest |
| Average Response Time (ms) | The average time it takes to respond to a user request |
| Count | The number of requests with successful responses |
| Error Count | The total number of errors that occurred |
| Fatal Exception Count | The total number of fatal exceptions that occurred |
| Throughput (rpm) | The number of requests received per minute |
| Error Rate (%) | The percentage of errors that occurred |
| JVM CPU usage (%) | The percentage of CPU usage by the Java virtual machine (JVM) |
| Heap Memory Usage (%) | The percentage of heap memory used by the JVM |
| GC Count | The number of global garbage collections that occurred |
| GC Time (ms) | The time taken to perform garbage collection |
Instance Split up tab
In general, you can see a comprehensive list of all the instances in your application, along with the metrics associated with them.

When you click on an individual instance, you will be taken to the respective Instance details page.
| Parameters | Description | Available For |
|---|---|---|
| Apdex Score | A numerical measure of user satisfaction, with 1 representing the highest and 0 representing the lowest. | Java, .NET, Node.js, PHP, Ruby, Python |
| Satisfied (count) | The number of transactions that are labeled as Satisfied. Note
If any transaction response time scores values below the Apdex threshold value, the transaction is labeled as Satisfied. |
Java, .NET, Node.js, PHP, Ruby, Python |
| Tolerating (count) |
The number of transactions that are labeled as Tolerating. Note
If any transaction response time is exactly equal to Apdex threshold, or in between satisfied and frustrated threshold values, it is labeled as Tolerating. |
Java, .NET, Node.js, PHP, Ruby, Python |
| Frustrated (count) |
The number of transactions that are labeled as Frustrated. Note
If any transaction response time scores above four times the Apdex threshold, the transaction is labeled as Frustrated. |
Java, .NET, Node.js, PHP, Ruby, Python |
| Resp.Time (ms) | The average time taken by the instance to respond to user requests. | Java, .NET, Node.js, PHP, Ruby, Python |
| Throughput (rpm) | The number of requests received per minute. | Java, .NET, Node.js, PHP, Ruby, Python |
| Req.Count | The total number of requests received. | Java, .NET, Node.js, PHP, Ruby, Python |
| Errors (%) | The percentage of errors that occurred. | Java, .NET, Node.js, PHP, Ruby, Python |
| Status | The status of the instance, like Up, Down, Trouble, or Critical. | Java, .NET, Node.js, PHP, Ruby, Python |
| Host | The hostname of the instance. | .NET |
| IP |
The IP addresses of the instance. Note
Hovering over the value displays the complete IP list. |
Java, .NET |
Click on this hamburger icon (![]() ) and select Export as PDF to export the Instance metrics report.
) and select Export as PDF to export the Instance metrics report.
